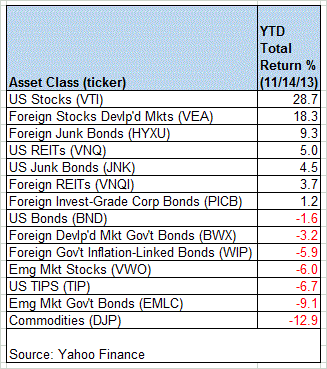
How high will it go? It’s getting harder to ignore the question as the US stock market’s 2013 rally rolls on. As of yesterday’s close, our ETF proxy for US equities (Vanguard Total Stock Market (VTI)) is approaching a 29% gain for the year so far, or more than three times higher than the long-run annualized performance record for the asset class. Once again we have a real-world reminder that momentum can’t be denied, at least in the short term. The tricky part, of course, is deciding when positive momentum turns into its darker twin.
Speaking of momentum, it’s fair to say that it comes in a wide range of flavors this season among the major asset classes. US equities are firmly in the lead, but it’s a long way down to the bottom. An exchange-traded note that tracks a broadly defined commodities index (DJ-UBS Commodity) is off nearly 13% so far in 2013–this year’s performance equivalent of Hades.
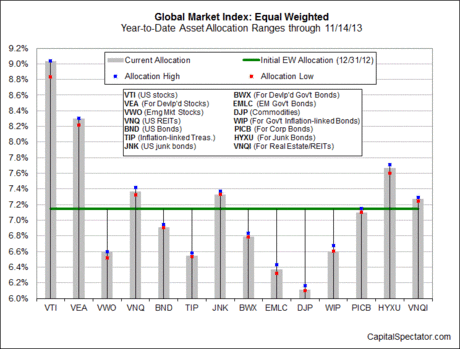
For another perspective on how the numbers compare, let’s review the relative changes in the asset allocation of an equal-weighted portfolio of all the major asset classes this year. The chart below reviews the portfolio’s components (based on proxy ETFs) via the current allocations vs. the range of weights year to date, using a start date of Dec. 31, 2012. The strategy for this illustration is equally weighting everything and letting the unmanaged allocations fluctuate freely through yesterday’s closing prices on November 14.
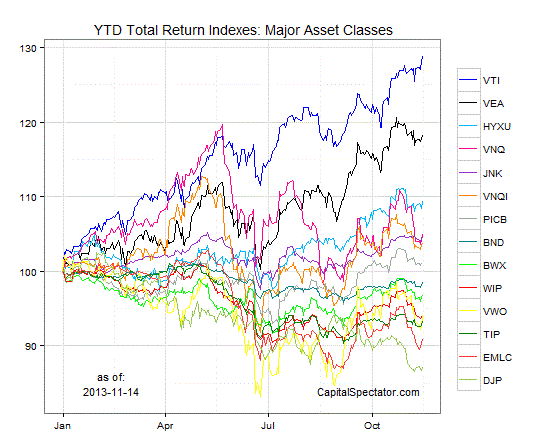
Now let’s turn to the horse race in terms of how the individual markets for the major asset classes have performed by the yardstick of price. The next chart shows the year-to-date performance in relative terms through November 14 with all the proxy ETFs rebased to 100 as of Dec. 31, 2012:
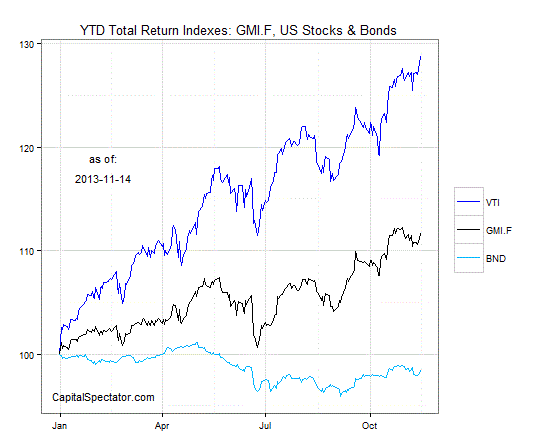
Next, here’s how an ETF-based version of a passive, market-value-weighted mix of all the major asset classes stacks up so far in 2013–the Global Market Index Fund, or GMI.F. This investable strategy benchmark is higher by nearly 12%, or roughly midway between the year-to-date returns for US stocks and bonds.
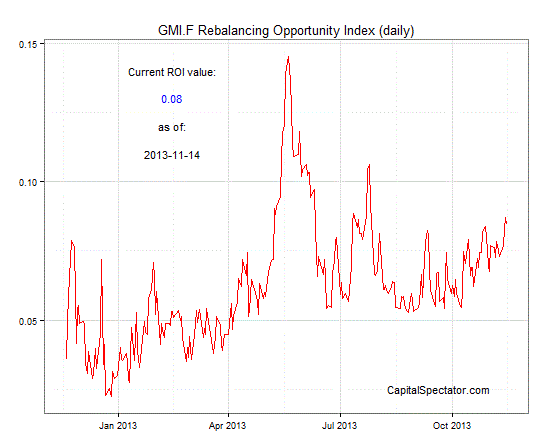
Comparing the dispersion of returns for major asset classes via ETFs suggests that the rebalancing opportunity is rising. Analyzing the components of GMI.F via the median absolute deviation of rolling one-year returns–the GMI.F Rebalancing Opportunity Index, as it’s labeled on these pages–suggests that there’s more potential for adding value by reweighting the portfolio in comparison with the last several weeks. The current level of dispersion is still well below the peak we saw in May of this year–a peak that we now know was a great time to rebalance. Yesterday’s dispersion reading still pales by comparison, although the upward trend of late is gaining strength. In other words, the range of returns is widening.
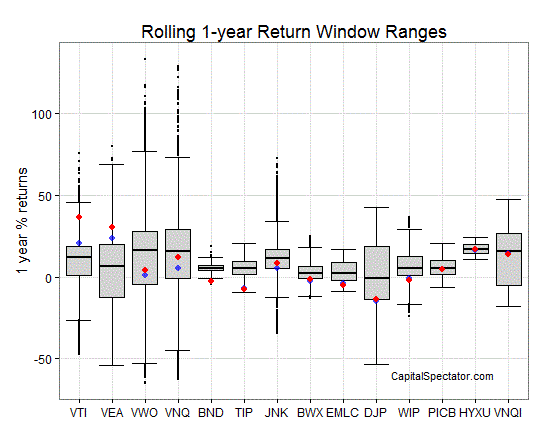
Finally, let’s compare how the rolling 1-year returns for the ETFs in GMI.F stack up via boxplots (keep in mind that the historical records for these ETFs vary widely due to different launch dates for the funds). The gray boxes in the next chart shows the middle range of returns for each ETF—the 25th to 75th return percentiles. The red dots indicate the current 1-year return (as of Nov. 14) vs. the 1-year return from 30 trading days earlier (blue dots, which may be hiding behind the red dots in some cases). Suffice to say, US stocks (VTI) are on a roll. Yes, returns have been higher, but trees don’t grow to the sky, at least not forever. That’s another way of gently reminding that mean reversion, although it takes frequent and sometimes lengthy holidays, has a habit of showing up at awkward times relative to the crowd’s expectations.
For a deeper look at an ETF-based view of asset classes, consider the weekly updates via The ETF Asset Class Performance Review.
For more information and a recent sample, see CapitalSpectator.com/premium.