Risk management doesn’t attract a crowd these days. Diversification and rebalancing? Meshach, Shadrach, and Abednego, say the bulls. It’s all about (positive) momentum. Discussions of tail risk and downside deviation are persona non grata at this party. So it goes when the winners keep on winning and risky assets (or at least some of them) dominate the horse race, week after week. It’s summertime and stocks are hot, along with a few other slices of the capital markets. Volatility is low, returns are high, and the fish are jumpin’. It’s the best of all worlds, and a growing portion of the crowd is slowly if inexorably seeing it (perhaps unconsciously) as the new normal.
We’ve read this script before, of course. Mr. Market has a devious habit of seducing a majority of investors into letting their guard down before pulling the plug. If you think about it, that’s as it must be. Trees can’t grow to the sky and fat fortunes in short-term trading strategies don’t routinely mint wealth for average Joes with off-the-shelf algorithms. If it were otherwise, who among the sane would settle for a “real job”? But history falls on deaf ears in finance and so everyone’s a genius in money management these days. Don’t worry, though. In the long run, the law of large numbers suggests that an ample supply of bakers, butchers and candlestick makers will prevail.
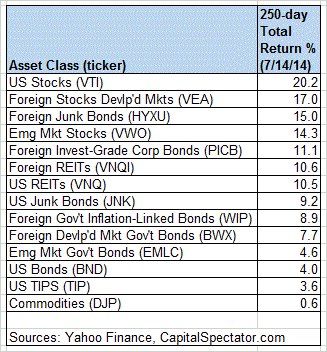
In the meantime, visions (delusions) of grandeur roll on. The proximate cause: losses are still nowhere to be seen on our standard list of ETF proxies for the major asset classes via 250-trading-day windows (the rough equivalent of 1-year returns). US stocks (VTI) remain at the pole position, boasting a 20% gain. Foreign equities in developed markets (VEA) are in second place with a 17% increase. The loser at the moment is a broadly defined mix of commodities (DJP), which is up incrementally at less than 1%.
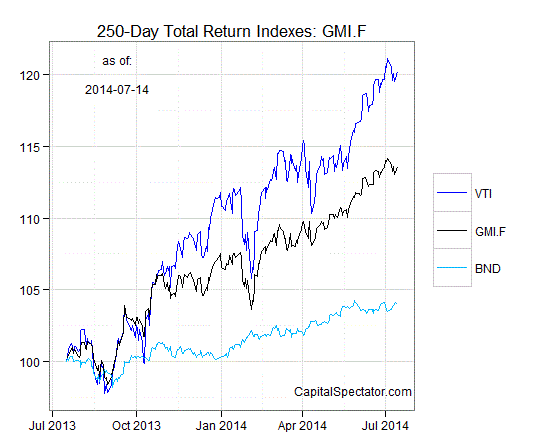
For a graphical summary, consider the relative performance histories for each of the major asset classes for the past 250 trading days by way of the ETF proxies. The chart below shows the performance records through July 14, 2014, with all the ETFs rebased to 100 using a start date of July 16, 2013:
Now let’s review an ETF-based version of an unmanaged, market-value-weighted mix of all the major asset classes–the Global Market Index Fund, or GMI.F, which is comprised of all the ETFs in the table above. Here’s how GMI.F stacks up for the past 250 trading days through July 14, 2014. This investable strategy has climbed 13.6% over that time frame, or roughly midway between the returns for US stocks (VTI) and US bonds (BND).
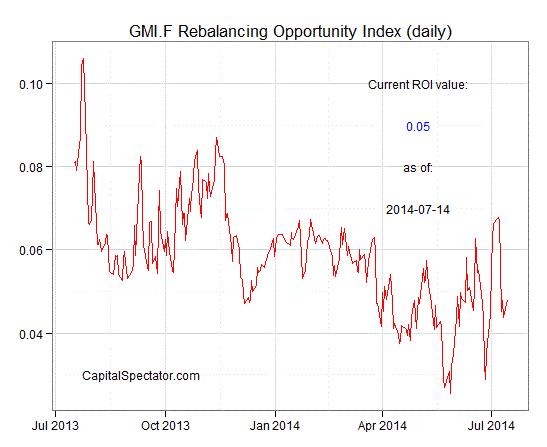
Comparing the overall dispersion of returns for the major asset classes via ETFs suggests that there’s a bit more rebalancing opportunity for GMI.F vs. recent history. That’s a function of a slightly wider array of 250-day returns for all the ETF proxies lately. Analyzing the components of GMI.F with a rolling median absolute deviation of one-year returns for the ETFs–the GMI.F Rebalancing Opportunity Index, as it’s labeled on these pages–suggests that there’s a bit more potential generally for adding value by reweighting this portfolio in comparison with recent weeks. Keep in mind that the opportunity for productive rebalancing will vary depending on the choice of holdings and historical time window. Meantime, don’t overlook the possibility that any given pair of ETFs may present a substantially greater or lesser degree of rebalancing opportunity vs. analyzing GMI.F’s components collectively.
Finally, let’s compare the rolling 1-year returns (250-trading-day performance) for the ETFs in GMI.F via boxplots for a revealing comparison of price momentum. The gray boxes in the chart below reflect the middle range of historical 250-day returns for each ETF—i.e., the 25th to 75th return percentiles. The red dots show the current return (as of July 14) vs. the 250-day return from 30 trading days earlier (blue dots, which may be hiding behind the red dots in some cases). As you can see, the current 250-day return is generally elevated relative to this profile from 30 days ago. In short, the bulls continue to reign supreme. Talking about risk, by contrast, has all the appeal of soap dish.
The ETF Asset Class Performance Review, which offers a deeper look
at an ETF-based view of asset classes. For more information and a
recent sample, see CapitalSpectator.com/premium.


