The wide array of returns for the major asset classes in recent history continue to present investors with a study in contrasts. The varied performances also represent a real-time experiment for navigating the rocky terrain of behavioral economics. A wide set of trailing returns are the raw material for a productive round of rebalancing, at least in theory. But it’s also typical to wonder if paring the allocations in the winners and raising portfolio weights in the losers is a smart move this time. Ample return spreads between asset classes look attractive on paper, but rebalancing your portfolio in a bid to capture the expected opportunity is always psychologically challenging. Indeed, it’s hard to buy assets when there’s blood running in the streets. Why? In the dry language of econometrics it boils down to one question: Does reversion to the mean still apply? Deciding how and when to rebalance is never easy or even obvious. But in the long run, it’s the only game in town for a multi-asset class portfolio. But it always comes with risk.
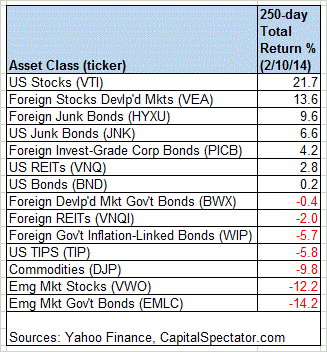
In any case, deciding if it’s timely to rebalance, or not, begins with the numbers. Let’s review how the returns for the major asset classes compare with our standard set of ETF proxies using a 250-trading-day window (an approximation of 1-year returns). US equities are still in the lead by a wide margin, although the performance edge isn’t quite as hot as it was a few weeks ago. Still, there’s no mistaking who’s running in the front of the horse race these days.
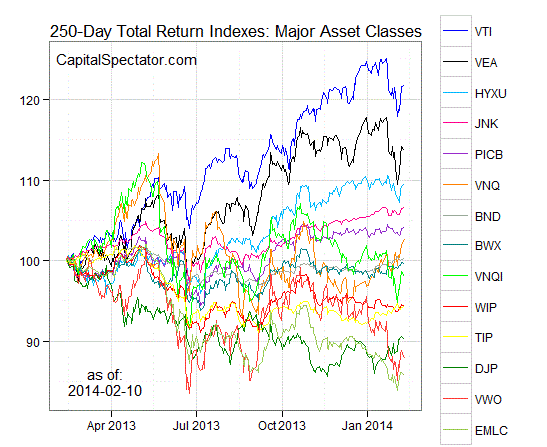
Let’s look at the numbers in graphical form by stacking up the relative return histories for each of the major asset classes for the past 250 trading days. The next chart shows the performance records through February 10, 2014, with all the ETFs rebased to 100 based on a start date of Feb 12, 2013:
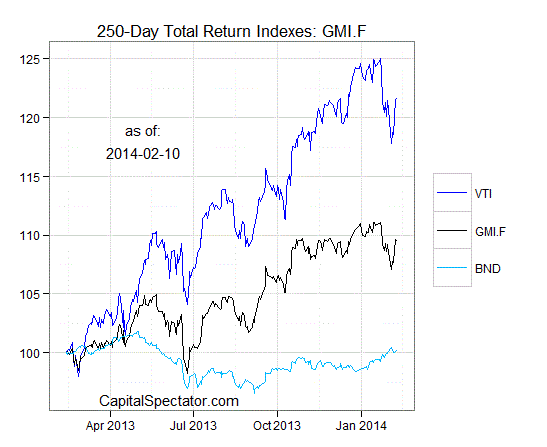
Now let’s consider an ETF-based version of a passive, market-value-weighted mix of all the major asset classes–the Global Market Index Fund, or GMI.F, which is comprised of all the ETFs in the table above. Here’s how GMI.F stacks up for the past 250 trading days through February 10, 2014. This investable strategy is higher by around 9% over that span, or roughly midway between the returns for US stocks (VTI) and US bonds (BND) over the same period.
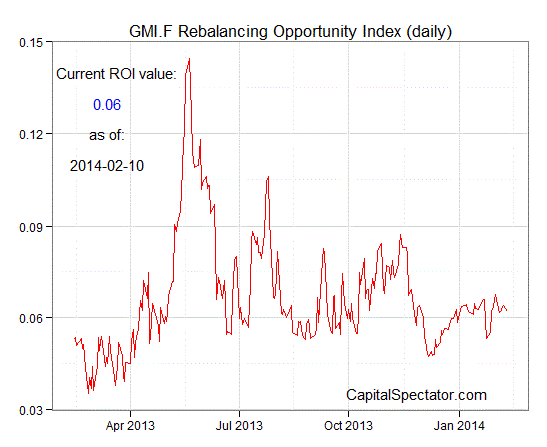
Comparing the overall dispersion of returns for the major asset classes via ETFs suggests that the rebalancing opportunity is relatively middling for GMI.F vs. recent history. Analyzing the components of GMI.F with the rolling median absolute deviation of one-year returns for all the funds–the GMI.F Rebalancing Opportunity Index, as it’s labeled on these pages–suggests that there’s average potential overall for adding value by reweighting this portfolio in comparison with the past several months. (Keep in mind that the potential for rebalancing will vary depending on the choice of holdings and historical time horizons to study.)
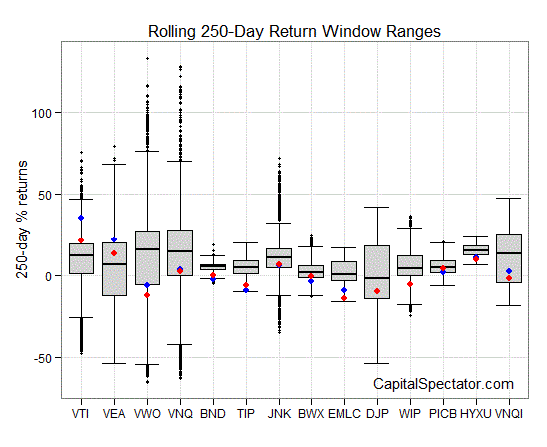
Finally, let’s compare the rolling 1-year returns (defined here as 250-trading-day performance) for the ETFs in GMI.F via boxplots. (Note that the historical records for these ETFs vary due to different launch dates.) The gray boxes in the chart below reflect the middle range of historical 250-day returns for each ETF—the 25th to 75th return percentiles. The red dots indicate the current return (as of February 10) vs. the 250-day return from 30 trading days earlier (blue dots, which may be hiding behind the red dots in some cases). Note that the red dots are generally below the blue dots for equities at the moment, which is a sign that trailing returns have been falling relative to recent history. By contrast, the red dots tend to be above the blue dots for bonds, which reflects stronger performance of late. Fixed-income, in other words, is drawing more buyers these days, at least on the margins in comparison with recent history.
