Can you say “rebound”? Mr. Market can. Asset prices have taken a sharp turn higher in September, or at least some of the recently battered markets fall into that category, as today’s comparison with the previous update on August 28 reminds. The general change since then is striking, considering the breadth of negative momentum as last month slumped to a close. It’s anyone’s guess if the revival of late will continue, but for the moment the bulls have made a bit of progress in putting the bears on the defensive, if only on the margins.
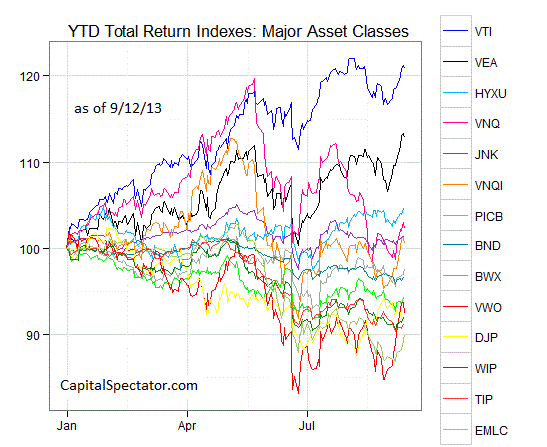
Let’s examine the details, starting with this year-to-date review of the major asset classes. US stocks remain firmly in the lead, with our proxy ETF (Vanguard Total Stock Market (VTI)) higher so far this year by nearly 21%. At the opposite end of the spectrum, emerging markets bonds inhabit the bottom rank, shedding 10% in 2013 through September 12. Nonetheless, emerging markets bonds have mounted a moderate rally so far this month and so the absolute decline is a bit less painful than it has been. Ditto for emerging markets stocks, which have moved up a few notches in the horse race this year, courtesy of the recent rally. Vanguard FTSE Emerging Markets (VWO) has pared its recent year-to-date loss to a 7.5% drop, which is a decent improvement in relative terms vs. the 15% retreat that prevailed near the end of last month.

Thanks to the recent rebound in markets, the spread in allocations have narrowed a bit for an equally weighted portfolio of all the major asset classes. Based on a start date of Dec. 31, 2012 for the equal weights, the chart below depicts the current portfolio composition (based on proxy ETFs) in context with the range of allocations year to date. The strategy for this illustration is equally weighting everything and letting the unmanaged allocations fluctuate freely through yesterday’s close (September 12). The intent here is providing some context for how the major asset classes have evolved so far this year in relative terms.

Here’s another view of how the major asset classes have performed this year (based on daily closing prices) in relative terms through September 12, 2013. In the next chart below, all the ETF prices have been reset to 100 as of Dec. 31, 2012:

In a new feature for these updates, let’s consider how the Global Market Index (GMI) compares with proxy ETFs for US stocks and bonds. GMI, by the way, is a market-value weighted, unmanaged mix of all the major asset classes, which means that it’s a robust benchmark for a wide array of investment strategies. For direct comparison with our ETF-based view of market activity, let’s use GMI.F, an investable version of GMI that replicates the index with a representative sample of ETFs. On a year-to-date basis, GMI.F is higher by 7.0% through September 12. By comparison, US stocks (VTI) are ahead 20.8% this year while US bonds (BND) are lower by 3.5%.

By the way, if you find these reviews valuable, you may be interested in the comprehensive weekly updates via The ETF Asset Class Performance Review, which goes into greater detail with tracking and analyzing global market activity in search of deeper perspective for identifying rebalancing opportunities. For more information and a recent sample, see CapitalSpectator.com/premium