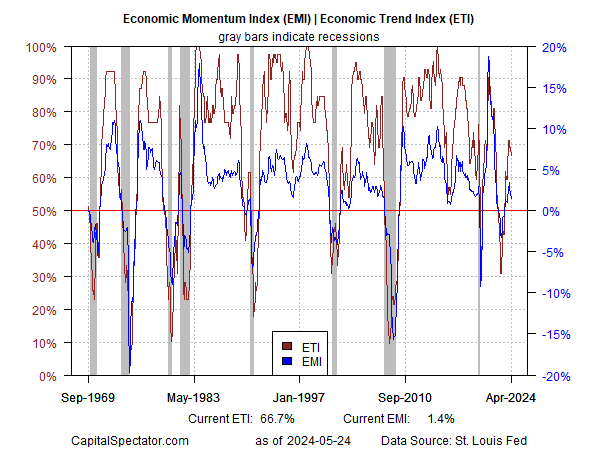
A broad set of US economic indicators continue to show that the odds are low that an NBER-defined recession has started or is imminent. This profile upends the dark narrative favored in some quarters. There are possible warning signs brewing on the horizon, but the case for expecting trouble is still weak, according to the numbers.
The basis for this view rests on a set of proprietary indicators featured in the weekly updates of The US Business Cycle Risk Report, a sister publication of CapitalSpectator.com. As reported in the May 25 issue, the macro trend peaked earlier in the year and is slowing, but the current reading for April remains moderately net positive.
Looking ahead, the possibility is rising that one or both of the indicators in the chart above will fall below their respective tipping points that mark recession. To gauge this possibility, an econometric technique is used to generate forward estimates of both indicators through June. On that basis, the outlook is mixed. One indicator (ETI) continues to decline, although it’s expected to remain above its 50% tipping point. By contrast, EMI has ticked up recent and is on track to remain steady at a moderately positive reading through next month.
For a deeper review of where trouble may be lurking in the months ahead, consider the underlying components of ETI and EMI, as shown in the table below. The labor market is on the short list for possible net-negative contributors to the economic trend. Notably, the Labor Market Index (an aggregate measure of four measures) continues its on-again-off-again dance with red ink in April by going slightly negative. A second month with a sub-zero reading would be a warning sign that macro momentum will continue to deteriorate rather than stabilize.
Note, too, that real retail sales and industrial production ticked into negative territory in April vis the 1-year trend. A continuation of the red ink in the upcoming May profile would add to the potential that the economy will soon slip over the edge.
Despite these concerns, it’s important not to be overly focused on a handful of indicators. Ultimately what matters is the how the aggregate trend evolves. To do so, I use a robust econometric technique with an encouraging history to generate forward estimates of all the indicators shown above, and thereby forecast ETI and EMI. The results strongly suggest that the US expansion will continue through June. (Keep in mind that the latest month with a full data set is February, per the table above.)
The bottom line: if recession risk is set to rise to a significant level, the evidence may arise as early as some point in the second half of the year. For some analysts it’s tempting to guesstimate the timing of that risk. But history reminds that attempting to look beyond a month or two in the cause of generating high-confidence business-cycle signals tends to be guesswork rather than reliable economic analysis.
How is recession risk evolving? Monitor the outlook with a subscription to:
The US Business Cycle Risk Report


