Economic reports in recent weeks suggest that the growth trend for the US has decelerated, but the softer numbers in the aggregate still fall short of reflecting substantially higher recession risk. The outlook is moderately darker from the vantage of financial and commodities markets, but for the moment there’s no clear sign that a downturn is imminent via the economic numbers overall.
Near-term projections of The Capital Spectator’s proprietary business cycle indexes point to a positive macro trend for the immediate horizon. The question is whether the recent warnings by way of markets will find support in the hard economic data in the weeks and months ahead? If that happens, the earliest point for a data-based regime shift is September. As for August, most of the preliminary figures are in and there’s still a healthy tailwind blowing. Nonetheless, watching the incoming data closely is a high priority at this stage in the wake of recent events.
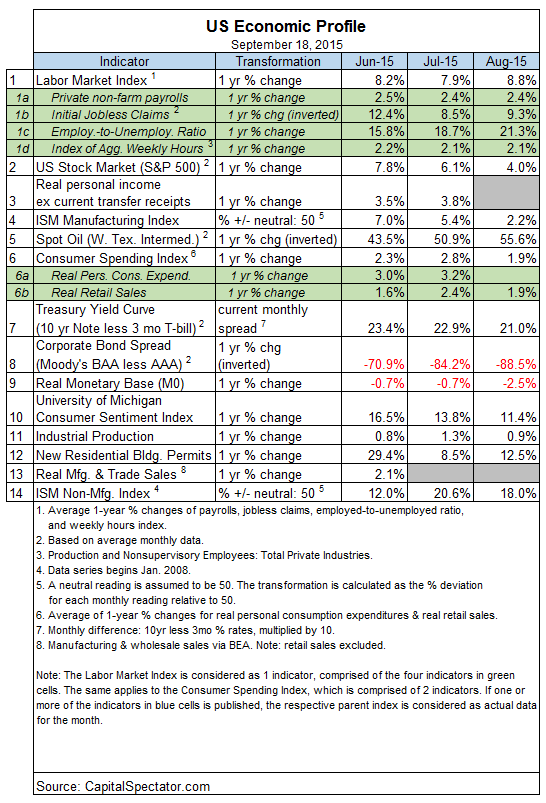
As for analyzing the published data to date, the broad trend still looks favorable, albeit with some cuts and bruises relative to last month’s update. Notably, the year-over-year change in the real (inflation-adjusted) monetary base has fallen modestly deeper into the red. There’s also an ongoing warning sign in the corporate yield spread. In addition, the recent weakness in industrial production bears attention—the 0.9% annual increase is the lowest since the Great Recession. If there’s trouble brewing, we’ll see the telltale signs accumulate in the weeks ahead as new macro numbers are published.
For the moment, the main threat is a higher probability of slower growth. That could lead to a recession, of course, but there’s no hard evidence for that scenario at this point. The data set that’s available today continues reflect a generally upbeat trend. Using based on a methodology outlined in Nowcasting The Business Cycle: A Practical Guide For Spotting Business Cycle Peaks, an aggregate of economic and financial behavior shows that business-cycle risk remained low through last month. In other words, slower growth is likely to persist. The Economic Trend and Momentum indices (ETI and EMI, respectively) are still at levels that equate with expansion. The current profile of published indicators through last month (12 of 14 data sets) for ETI and EMI reflect a positive trend overall. The two exceptions at this point: the corporate bond spread and the real monetary base. If and when the red ink spreads to other indicators, the outlook would change.
Here’s a summary of recent activity for the components in ETI and EMI and the various calculations that are used to calculate the trend benchmarks:
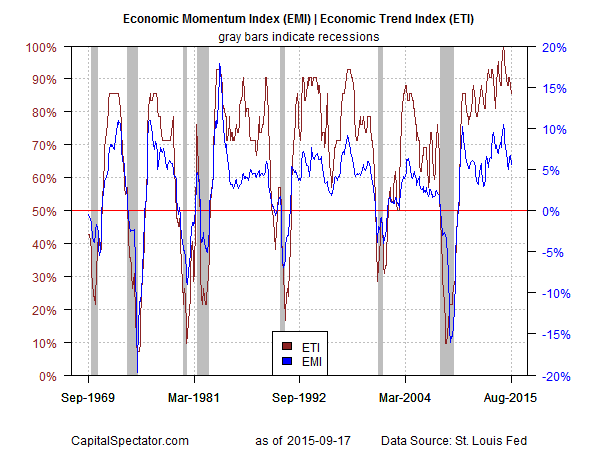
Aggregating the data into business cycle indexes reflects positive trends overall. The latest numbers for ETI and EMI indicate that both benchmarks are well above their respective danger zones: 50% for ETI and 0% for EMI. When the indexes fall below those tipping points, we’ll have clear warning signs that recession risk is elevated. Based on the latest updates for August — ETI is 85.7% and EMI is 5.6% — there’s still a wide margin of safety between current values and the danger zones, as shown in the chart below. (See note at the end of this post for ETI/EMI design rules.)
Translating ETI’s historical values into recession-risk probabilities via a probit model also points to low business cycle risk for the US. Analyzing the data with this methodology implies that the odds are virtually nil that the National Bureau of Economic Research (NBER) — the official arbiter of US business cycle dates— will declare last month as the start of a new recession.

For another perspective, consider how ETI may evolve as new data is published. One way to project future values for this index is with an econometric technique known as an autoregressive integrated moving average (ARIMA) model, based on calculations via the “forecast” package for R, a statistical software environment. The ARIMA model calculates the missing data points for each indicator, for each month through October 2015. (Note that June 2015 is currently the latest month with a complete set of published data.) Based on today’s projections, ETI is expected to remain well above its danger zone for the near term. (Keep in mind that frequent business cycle updates are available throughout each month with a subscription to The US Business Cycle Risk Report.)
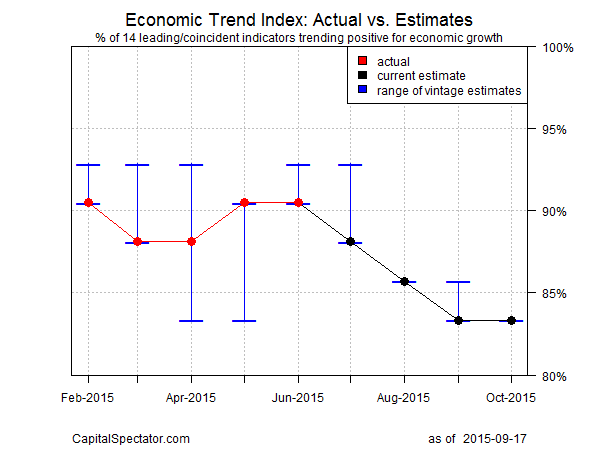
Forecasts are always suspect, of course, but recent projections of ETI for the near-term future have proven to be relatively reliable guesstimates vs. the full set of published numbers that followed. That’s not surprising, given the broadly diversified nature of ETI. Predicting individual components, by contrast, is prone to far more uncertainty in the short run. The latest projections (the four black dots on the right in the chart above) suggest that the economy will continue to expand. The chart above also includes the range of vintage ETI projections published on these pages in previous months (blue bars), which you can compare with the actual data that followed, based on current numbers (red dots). The assumption here is that while any one forecast for a given indicator will likely miss the mark, the errors may cancel out to some degree by aggregating a broad set of predictions. That’s a reasonable assumption when we review the historical record for the ETI forecasts.
For additional perspective on judging the track record of the forecasts, here are the previous updates for the last three months:
19 Aug 2015
20 Jul 2015
17 Jun 2015
Note: ETI is a diffusion index (i.e., an index that tracks the proportion of components with positive values) for the 14 leading/coincident indicators listed in the table above. ETI values reflect the 3-month average of the transformation rules defined in the table. EMI measures the same set of indicators/transformation rules based on the 3-month average of the median monthly percentage change for the 14 indicators. For the chart showing EMI and ETI through last month, and for the near-term forecasts, the missing data points are estimated with an ARIMA model.
Pingback: Growth Trend for US Economy Has Decelerated
Pingback: U.S. Markets’ Wary Outlook: Risk Less Severe But Still Worrisome
Pingback: Is The U.S. Business Cycle Dead…Or Just Dormant?