Last week’s post on analyzing US equity value and momentum risk premia ended with a question: How much, if any, improvement should we expect by adding a dynamic system for managing exposure to these risk factors vs. a buy-and-hold strategy? What follows is a preliminary effort in searching for an answer. As a preview, the results are mixed, but this may be an artifact of a) focusing on value and momentum factors within the US equity space; b) using a specific definition of value and momentum (via Professor Ken French’s data library), which merely scratches the surface for modeling possibilities; and c) applying a simple tactical model that may be responsive to parameter changes for enhancing results.
Let’s start by comparing the momentum and value factors separately, in two flavors: a buy-and-hold (BH) strategy and a tactical strategy. Tactical asset allocation has endless variations, but it’s become standard in recent years to use Meb Faber’s widely cited model —“A Quantitative Approach to Tactical Asset Allocation”–as a benchmark. The original 2007 paper studied the results of applying a simple system of moving averages across asset classes. The impressive results are generated by a model that compares the current end-of-month price to a 10-month average. If the end-of-month price is above the 10-month average, buy or continue to hold the asset. Otherwise, sell or hold cash for the asset’s share of the portfolio. The result? A remarkably strong return for the Faber TAA model over decades, in both absolute and risk-adjusted terms, vs. buying and holding the same mix of assets. But as we’ll see, replicating these results for a US equity set of value and momentum premia can get messy.
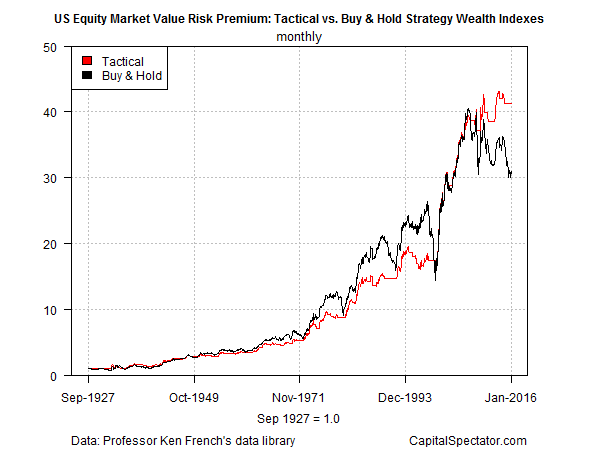
Here’s how the US equity value premium stacks up as a BH strategy vs. a tactical model across the decades. Note the BH results tend to have an edge, which goes into overdrive for the ~20 years through the first half of the 1990s. But it all comes apart in the 21st century as BH stumbles sharply vs. a tactical approach.
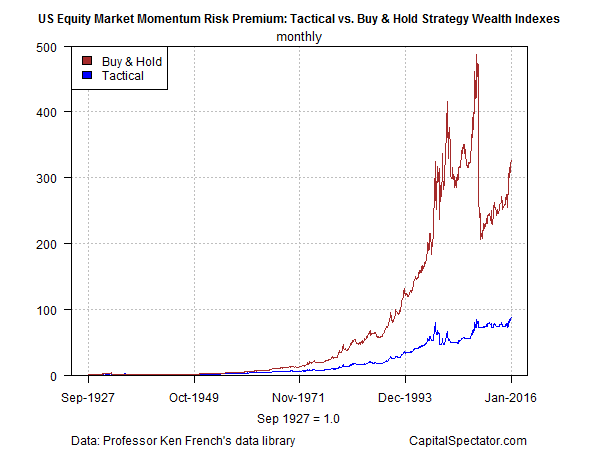
The historical differences are far more dramatic for momentum in BH vs. tactical models. Indeed, BH crushes tactical here, generating sharply higher returns through the decades. The price tag is substantially higher volatility, including a hefty reversal of fortunes during the 2008-2009 financial crisis. Even so, BH’s performance in the momentum space leaves the tactical strategy in the dust.
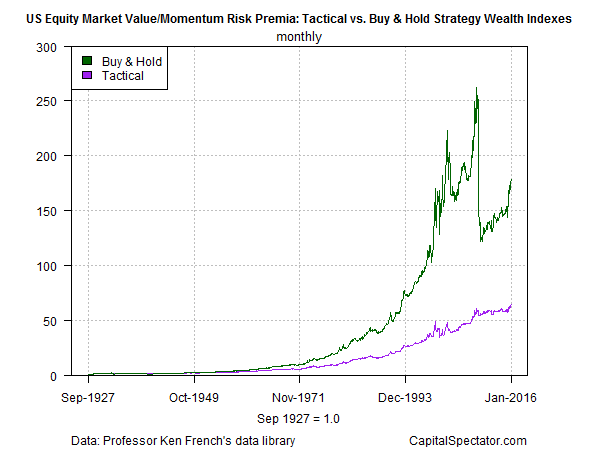
Is there any advantage to combining momentum and value in a tactical strategy? For some insight, let’s use the tactical model outlined above for both factors and create a portfolio that initially sets equal weights for the strategies. For comparison, we’ll also set up a BH version of the two factors that’s equally weighted at the outset. The main result, as you can see in the next chart below, is that combining the two factors reduces performance for BH and tactical. That’s no surprise, given the sharply higher returns in momentum vs. value—i.e., blending the two is destined to suffer a reduction in performance due to the lesser returns via value. Meantime, BH retains a sizable edge over tactical with equal-weight mixes of value and momentum. The caveat for BH is that it suffers substantially higher volatility, including dramatic drawdowns.
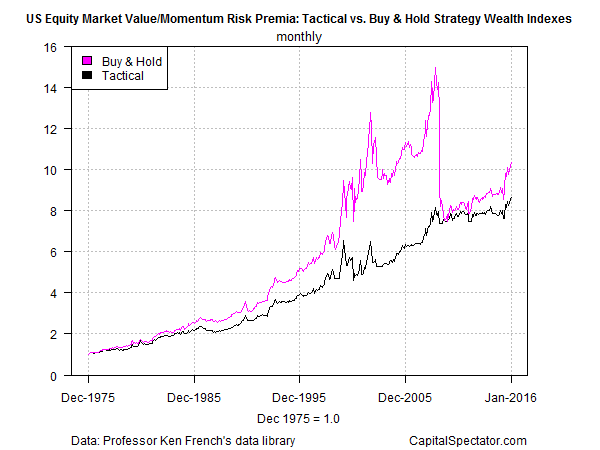
Analyzing results over long stretches of time—from the late-1920s onward in the charts above—has advantages, but perhaps a shorter time horizon that reflects recent activity offers a more practical perspective for real-world money management. We run the risk of data mining, of course, but it’s reasonable to wonder if markets have changed enough so that looking further back beyond, say, 40 years leads to misleading results. A dubious notion? Perhaps, but let’s throw caution to the wind and review the results for an equal-weight blend of value and momentum via BH and tactical models with a start date of Dec. 1975. The general results are the same: BH outperforms tactical, but the advantage is less extreme. In fact, thanks to BH’s dramatic tumble in 2008-2009 the two strategies exhibit relatively similar results through this past January.
The main takeaway from this preliminary review is that momentum generates substantially higher returns vs. value—an empirical fact that influences results in efforts to blend the two factor premiums.
Is the lesson to simply favor momentum over value? Some investors think so, but keep in mind that the analysis above is limited to a particular set of factor definitions within the US equity space. Yet there’s no reason to limit momentum and value applications to one asset class, much less to one country.
As for tactical asset allocation vs. buy and hold, one can make a case for either, but each side comes with considerable baggage. Ultimately, it’s an issue of preferences with regards to customizing portfolio strategies to satisfy a particular set of risk targets, investment horizons, and other variables.
AQR’s Cliff Asness and two colleagues recently summarized the encouraging results of applying a tactical overlay via momentum and value for a multi-asset class strategy. “Overall, for those who think market timing is infeasible, we give hope,” the authors write in Institutional Investor. “At the other extreme, some observers oversell market timing as easy and reliable. It ain’t.”
The caveat is especially germane for value and momentum in US equities. A multi-factor strategy can still be a prudent way to manage money, but it’s important to recognize that momentum is far more potent (and volatile) vs. value for US stock investing. The challenge is deciding how to interpret this historical information for customizing an investment strategy that’s appropriate for you (or your clients).
* * *
Previous articles in this series:
Portfolio Analysis in R: Part I | A 60/40 US Stock/Bond Portfolio
Portfolio Analysis in R: Part II | Analyzing A 60/40 Strategy
Portfolio Analysis in R: Part III | Adding A Global Strategy
Portfolio Analysis in R: Part IV | Enhancing A Global Strategy
Portfolio Analysis in R: Part V | Risk Analysis Via Factors
Portfolio Analysis in R: Part VI | Risk-Contribution Analysis
Tail-Risk Analysis In R: Part I
Managing Portfolio Risk With Tactical Asset Allocation
Tactical Asset Allocation For The Real World
We’re All Backtesters Now
Backtesting With Synthetic and Resampled Market Histories
3 Common Backtesting Traps With Easy Solutions
Using Random Portfolios To Test Asset Allocation Strategies
Skewed By Randomness: Testing Arbitrary Rebalancing Dates
Does Smart Beta = Smart Asset Allocation?


Pingback: 04/04/16 – Monday’s Interest-ing Reads | Compound Interest-ing!
Pingback: Quantocracy's Daily Wrap for 03/31/2016 | Quantocracy