US economic data has been a bit wobbly lately—the unexpected slide in February retail sales, which marks the third straight month of red ink, for instance. The optimists say this is just a soft patch for spending, weighed down by a harsh winter. The encouraging figures in other key indicators imply as much, including the upbeat numbers for payrolls. Perhaps, then, it’s no surprise to find that the real monetary base for the US continued to decline through February, laying the groundwork for the Federal Reserve’s first interest rate hike in nearly a decade. The arrival of policy tightening could come as early as June, according to some forecasters… assuming, of course, that economic growth holds up.
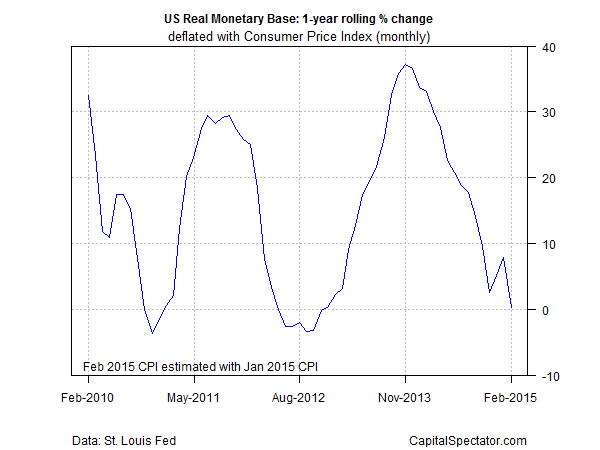
The recent deceleration in the growth rate in the real (inflation-adjusted) supply of so-called high-powered money or base money (M0) provides quantitative evidence that the central bank is continuing to wind down its stimulus efforts of recent years. The St. Louis Adjusted Monetary Base (deflated by the consumer price index) was nearly flat on a year-over-year basis through February 2015—a dramatic fall from the 30%-plus increases in late-2013 and early 2014. (Note that the Feb. 2015 CPI report will be published later this month; meantime, I’m using Jan. 2015 data as an estimate for last month’s inflation numbers. Otherwise, historical CPI figures are used to deflate M0.)
The sharp deceleration in the annual growth rate of the monetary base alone isn’t a guarantee that that the Fed will start hiking its policy rate in the near-term future, but it’s a telling clue. More context is due next week (Wed., Mar. 18), when the central bank will publish a new FOMC statement, which will be followed by Janet Yellen’s press conference and a fresh set of economic projections.
Meantime, how should we interpret the recent trend in the monetary base? True, it’s only one clue and should be read within a broader context of economic and monetary data. That said, it’s likely that whenever the Fed decides to start hiking rates the change will arrive in the wake of a conspicuously lesser rate of growth in the monetary base, which certainly describes recent history.
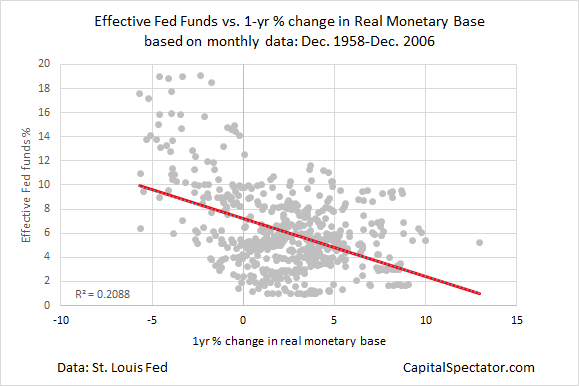
Indeed, history suggests as much. Consider how the effective Fed funds rate compares with one-year percentage changes in the real monetary base from the late-1950s through the end of 2006, which marks the end of “normal” policy, which is to say before monetary management went off the deep end in reaction to the Great Recession. Although the degree of this linkage ebbs and flows through time, there’s a noticeable trend across the decades that reminds us that higher Fed funds rates tend to be associated with lower annual changes in the real monetary base.
This negative correlation between money supply and rates (roughly -0.45 for the data in the chart above) is hardly surprising. David Hume’s 1752 treatise “On Money” anticipated no less, as do countless papers on monetary theory that followed over the centuries. That doesn’t mean we won’t be surprised in 2015. Much depends on how the macro profile unfolds in the months ahead.
Given the latest figures on retail sales, there’s still reason to wonder if a rate hike is likely to arrive later rather than sooner. Perhaps Janet will enlighten us next week. Otherwise, the annual change in the real monetary base deserves to be on the short of clues to monitor. A low-to-flat pace alone may not be a sign of an imminent rate hike. On the other hand, a persistent rise in M0’s year-over-year rate at this stage would be a rather large hint for thinking that the Fed was again favoring later rather than sooner for squeezing policy.

