The US stock market’s recent turbulence took a breather yesterday, providing a bit of calm to the VIX Index, a measure of the implied volatility of S&P 500. Nonetheless, the VIX closed yesterday at its highest level in more than two years. Since Sep. 19, the VIX has doubled to 22.79 as of Oct. 14. Clearly, volatility has taken a sharp swing higher, raising worries that the so-called fear index is flashing a warning sign for the market. But interpreting the VIX, and market volatility generally, can be tricky. For some perspective, let’s consider how the VIX and several alternative measures of market volatility compare in an apples-to-apples framework via percentile ranking. By that standard, there’s still room for debate for interpreting the latest spike in vol.
Let’s start with a summary of the current percentile ranks for several measures of volatility (see definitions below). Using a rolling 3-year window for calculating percentile ranks certainly reflects an elevated level of risk. The VIX, for instance, is currently at the 92nd percentile relative to the past three years. Alternative measures of S&P 500 volatility, however, show varying degrees of lesser rankings:
      VIX EMA SD Garch.norm Garch.std
3yr:   92  86 78         91        91
10yr:  74  67 57         75        74
Risk levels look even lower when using a 10-year rolling window. The VIX, for instance, is at the 74th percentile rank by way of this look-back period. At the low end of the rankings is standard deviation, which is at a middling 57th percentile for the trailing 10-year period.
The one common feature that all the risk metrics share is a sharp increase relative to recent history. Here’s how the changes stack up for the 3-year rolling period through Oct. 14:
The latest spike doesn’t look quite so ominous via a 10-year rolling period. By this standard, the highest ranking is the 75th percentile (Garch.norm). That’s clearly elevated, but it’s still well short of a critical level.
It’s unclear which look-back period is optimal for gauging what’s in store for the immediate future. What we do know is that we can torture the data to say almost anything we want. On that note, there’s no mystery why the volatility levels are ranked lower for the 10-year rolling period vs. a 3-year window: the latter excludes the extreme surge in vol during the 2008 financial crisis. As a result, the current levels of vol look excessive, but only when viewed through the prism of the last three years, which has been a period of relative calm in the market.
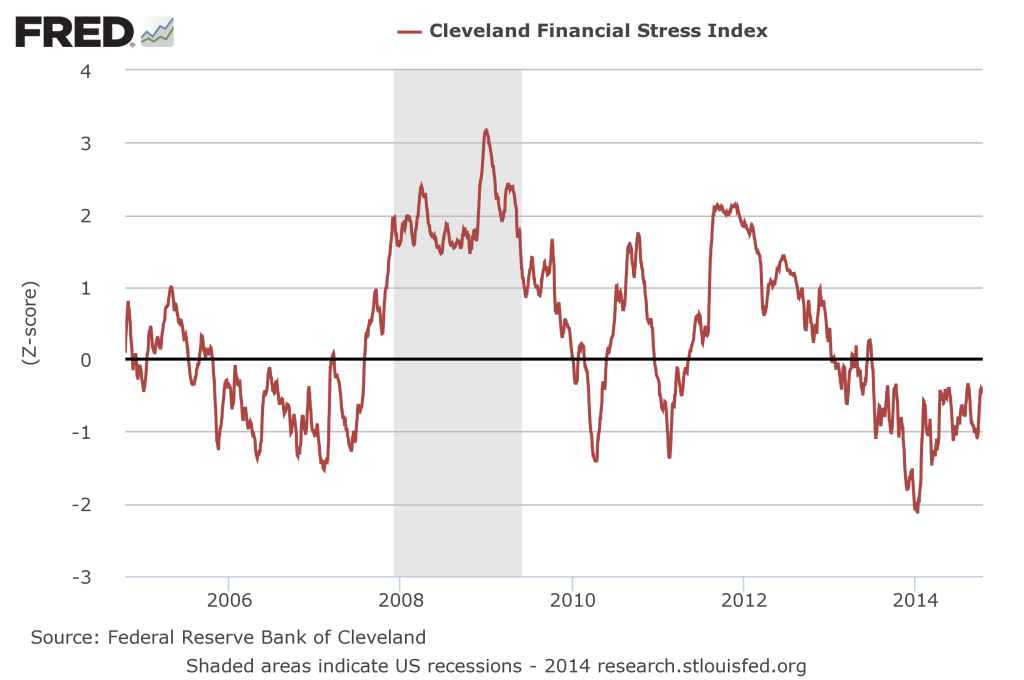
Speaking of crises, several measures of risk in the financial system look unthreatening at the moment. For instance, the Cleveland Fed Financial Stress Index (CFFSI) as of Oct. 13 was at a level (-0.477) that’s associated with a “normal” level of stress, based on guidelines for the benchmark.
Meantime, macro conditions for the US continue to reflect a moderate growth trend. The three-month average of the Chicago Fed National Activity Index through August pointed to an “above-trend” level of economic activity.
Does the generally upbeat numbers for financial stress and the economic trend mean that the recent increases in stock market volatility are irrelevant? No, of course not, although relatively calm and productive backdrops for the financial system and the economy are key factors for interpreting the recent rise in the VIX. As such, it remains debatable if the elevated level of market vol is the dark signal that some analysts say it is.
Then again, if volatility continues to rise in the days ahead, it may be time to reassess the outlook. Even the most enlightened analysis turns into ancient history the following morning.
***
The percentile rank data is calculated in R with the runPercentRank function. The five measures of S&P 500 volatility cited above are defined as follows:
VIX: market expectation of near term volatility for S&P 500 based on index option prices.
EMA: 30-day exponential moving average of the S&P 500’s squared daily % return.
SD: 30-day standard deviation of the S&P 500’s daily % return
Garch.norm: a Garch(1,1) model that assumes a normal distribution via the rugarch package in R.
Garch.std: a Garch(1,1) model that assumes a “fat-tail” distribution based on a Student’s t-distribution via the rugarch package in R.


