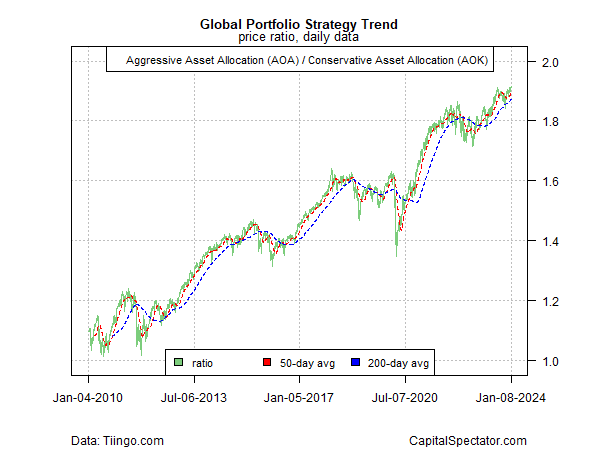
There’s no shortage of reasons to be cautious on the near-term outlook for markets, but reviewing trend behavior via several sets of ETF pairs continues to reflect a positive trend for risk assets through yesterday’s close (Jan. 8, 2023).
To be fair, every trend hits a wall eventually, and it’s often difficult if not impossible to successfully call turning points in real time. That caveat resonates at a time when a number of key markets are trading at or near record highs. Notably, the S&P 500 Index is just below its January 2022 peak, inspiring debate about whether the strong and relatively quick rebound from the October low has run out of road.
For another perspective, however, there’s still no sign of trouble via the ratio for an aggressive global portfolio (AOA) vs. its conservative counterpart (AOK). This proxy for risk appetite via a global asset allocation profile has retained a bullish bias despite worries that trouble is brewing. (For perspective, see the previous two updates here and here.)

A risk-on bias is still conspicuous via for US stocks (SPY) vs. a low-volatility subset (USMV), albeit after some turbulence in recent history that raised doubts about the staying power of the rally.

The relative performance of semi-conductor stocks (SMH), a business-cycle proxy, vs. US shares overall (SPY) still reflects a bullish trend.

Meanwhile, the ratio of housing stocks (XHB) to the broad equities market (SPY) continues to signal recovery for the housing sector, which previously took it on the chin in the wake of sharp interest rate hikes that took weighed heavily on the industry.

The bond market, however, is still wallowing in risk-off posture, based on medium-term Treasuries (IEF) vs. short-term governments (SHY). The recent bounce in this ratio suggests a bullish turning point is in progress following a bear market, but this ratio has yet to deliver a convincing reversal signal–the 50-day average for this ratio rising above its 200-day counterpart, for example.

Trend reversals are rarely if ever obvious until a new pattern has been established and so the analysis on this front is always suspect in some degree. But until a long-established trend shows convincing signs of reversing, there’s probably more risk in anticipating its demise before the numbers clearly support that call.
Learn To Use R For Portfolio Analysis
Quantitative Investment Portfolio Analytics In R:
An Introduction To R For Modeling Portfolio Risk and Return
By James Picerno