In first two previous articles in this series (see here and here) we reviewed basic applications for identifying outliers in data set – a crucial task for analyzing financial and economic time series. Let’s push on and kick the tires on another tool: the Hampel filter, another methodology to identify extremes values in a data set.
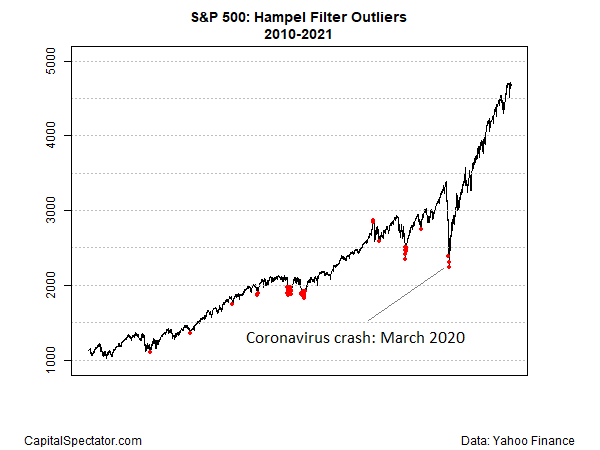
The key feature here is the use of median absolute deviation for quantifying variability. We’ll use prices for the US stock market (S&P 500 Index) starting in 2010 as a test, based on a rolling window of three months (60 trading days). The threshold, which determines sensitivity for identifying outliers, is set to 2.
Running the numbers on this basis identifies several instances of extreme outliers (red dots in chart below). The most recent: the coronavirus crash in March 2020.

One of advantage of the Hampel filter is its flexibility. By adjusting the two parameters – trailing window and the threshold – it’s easy to customize the search for outliers so as to match the research objective and data set’s unique features.
It’s easy to dismiss this type of analysis when looking at the S&P 500 data. Casual observation of the time series suggests that the outliers are conspicuous. Perhaps, but looking at rolling performance data can mask outliers via visual inspection. Also, less-familiar markets and economic time series can be more challenging for intuitively detecting outliers. That’s especially true if the task is to automatically identify and replace outliers in a large data set for a particular modeling exercise.
There are several alternatives to a Hampel filter for robust, flexible tools to detect extreme data points. In upcoming articles we’ll explore some of the possibilities. Ideally, several filters are applied in the search of outliers in the interest of developing deeply robust results.
Conceptually speaking, there is universal agreement on the case for profiling radical values in a data set. The specifics, however, can get murky, particularly if you’re relying on qualitative judgment. That’s a sign that it’s time to roll out quantitative analysis. In the cause of detecting outliers, the Hampel filter is an obvious choice, but it’s far from the only choice.
Learn To Use R For Portfolio Analysis
Quantitative Investment Portfolio Analytics In R:
An Introduction To R For Modeling Portfolio Risk and Return
By James Picerno