Interest rates have increased moderately since Donald Trump’s election victory two weeks ago and analysts say that yields may trend higher in the months ahead. What does that imply for the stock market and the economy? As a preliminary answer, let’s model the possibilities by analyzing the historical record since 1960 for changes in interest rates and three key macro variables.
First, here’s a quick recap of where we stand in terms of the data. The benchmark 10-year Treasury yield reached 2.33% yesterday (Nov. 21), up from 1.88% on Election Day, Nov. 8, based on daily numbers from Treasury.gov. Economists explain the shift in bond-market sentiment as a reaction to expectations that Trump’s plans for lower taxes and higher spending on infrastructure projects point to a reflation trend for the economy. Monetary policy is expected to react next month. Fed funds futures are pricing in a near-certain probability of rate hike for the Federal Reserve’s Dec. 13-14 FOMC meeting, according to CME data (as of Nov. 21).
Conventional wisdom suggests that higher interest rates are a negative for the economy and the stock market. Let’s test this idea with an econometric tool called impulse-response (IR) simulations based on vector autoregression (VAR) modeling. The goal is to quantify how a given variable (the stock market, consumer spending, etc.) change in the wake of a “shock”—higher interest rates in this case. (I’ll use R to crunch the numbers via the vars package. If you’re curious about the code, you can find the basic framework here.)
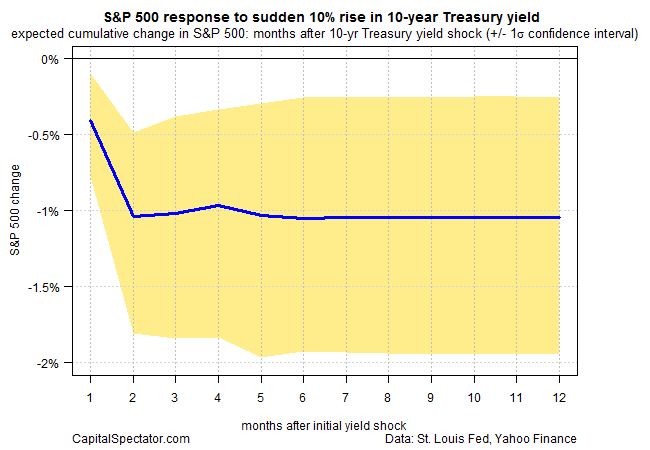
Now for the task at hand. Let’s start by considering how a 10% pop in the 10-year Treasury yield might impact the US stock market (S&P 500). The technique in the VAR modeling is to use the historical relationship between the two datasets to simulate the future path. The result is depicted in the graph below, which projects a roughly 1% decline for equities when the 10-year yield jumps 10%, based on the point estimate (blue line). In other words, equity prices are expected to suffer a relatively mild retreat relative to the size of rate increase. (By the way, we can adjust these figures for different scenarios. A 20% increase in rates, for instance, implies a ~2% drop in equities.)
The result isn’t terribly surprising. If a “safe” asset like the 10-year Note offers a more-compelling alternative for investors by way of a higher yield, history suggests (as per the VAR modeling) that the risky asset’s price will be discounted to compensate for the change and thereby maintain a competitive expected return. This makes sense when you assume that lower equity prices equate with higher expected performance, which is usually a reasonable hypothesis.
Next, let’s model how higher rates may impact private-sector payrolls in the US. This time the outlook is brighter, at least initially. A 10% increase in yield coincides with a mild but generally rising trend for employment growth. After 12 months, private payrolls are projected to increase by roughly 0.3%.
Why might payrolls increase? Perhaps because higher rates reflect a firmer economy generally. If so, companies can be expected to hire more workers.
Finally, let’s run the same analysis for consumer spending. VAR modeling suggests that personal consumption expenditures will also increase after a 10% rise in the 10-year yield, but only by a slim 0.15%. In comparison with the acceleration in the growth rate of employment, the positive “shock” for spending is projected to be a one-time event.
The caveat in the analysis above is that modeling the past as a guide to the future is only a rough approximation at best. Indeed, reflationary regime shifts come in a variety of flavors—variety that’s been smoothed over in the analysis above by modeling the entire half-century-plus period in one fell swoop. Note, too, that the VAR modeling in this simple example reviews just two variables at a time. In other words, we can and should go deeper for a more reliable projection. For instance, how might the projections compare if we modeled all the variables above simultaneously?
There’s always room for improvement, but the VAR framework is up to the challenge. As for what we’ve learned in our preliminary test, higher rates could pinch the stock market, at least temporarily, but a jump in yields also imply that employment and spending could tick higher in the early going.


Pingback: Interest Rates Have Increased Moderately Since Election - TradingGods.net