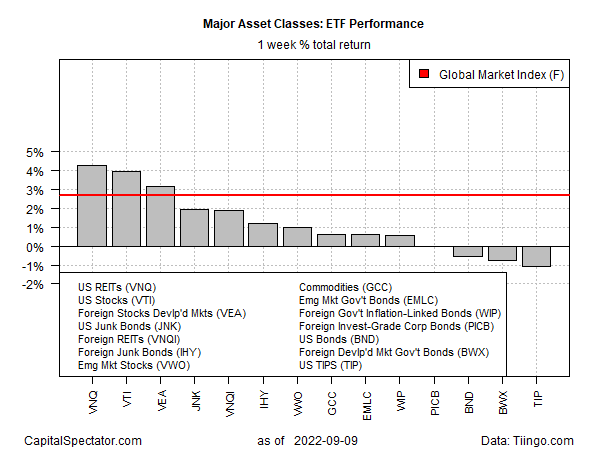
Most risk assets bounced in the trading week through Friday’s close (Sep. 9), based on a set of proxy ETFs that collectively represent the primary asset classes. Confidence that the bounce has legs is another matter.
US real estate investment trusts (REITs) led the advance via Vanguard Real Estate (VNQ), which jumped 4.3%. Despite the rise – the first weekly advance in a month – the trend bias for VNQ still looks weak/mixed. For the moment, the optimistic view is that the ETF is trading in a range.
A key factor for the near-term outlook for REITs, which are relatively sensitive to interest-rate changes: how far, how fast and long will the Federal Reserve raise interest rates? In turn, the answer is highly dependent on whether inflation has peaked and, if it has, how quickly it retreats from recent highs? The next data point on the subject is scheduled for tomorrow with the release of US consumer inflation numbers for August.

Overall, last week’s market gains were broad based, ranging from rallies in US stocks (VTI), equities in emerging markets (VWO) and commodities (GCC). Bonds, by contrast, tended to lose ground. Last week’s biggest setback: inflation-indexed Treasuries (TIP), which fell for a second week, settling near a three-month low.
Last week’s upside bias lifted the Global Market Index (GMI.F), which rose 2.7% — the first weekly gain in four weeks. This unmanaged benchmark, maintained by CapitalSpectator.com, holds all the major asset classes (except cash) in market-value weights via ETFs and represents a competitive index for portfolio strategy analytics.

For the one-year window, commodities (GCC) remain the lone winner — by a wide margin via a 12.0% gain.
The rest of the field remains underwater for the trailing one-year window. The biggest loser is still foreign corporate bonds (PICB) with a near 28% loss.
GMI.F’s one-year decline: -14.3%.

Using a drawdown lens to review the major asset classes shows that all but one are still posting peak-to-trough declines deeper than -10%. The outlier: inflation-protected Treasuries (TIP), which closed on Friday with a relatively modest drawdown of -9.3%.
GMI.F’s drawdown: -16.4% (green line in chart below).

Learn To Use R For Portfolio Analysis
Quantitative Investment Portfolio Analytics In R:
An Introduction To R For Modeling Portfolio Risk and Return
By James Picerno