The Economist recently asked: “Are financial markets useful indicators of how an economy is about to perform?” The answer, of course, is yes… sometimes, depending on the data sets and the econometric techniques. Generally speaking, however, real-time asset pricing provides a deep well of intelligence for estimating the state of the business cycle. But there are plenty of traps here. Separating the signal from the noise, as they say, requires some effort. There are no silver bullets, but one tool that deserves to be on everyone’s short list is a statistical measurement known as cross correlation (CC), which quantifies the relationship between two time series across a series of time lags.
For example, there’s a widely accepted belief that the stock market anticipates economic activity. The so-called wisdom of the crowd prices in boom and bust before the evidence shows up in the hard data in employment, industrial production, etc. Economic theory supports this idea, but do we have statistical support that this is how markets and macro actually behave? Yes, to a degree, and the smoking guns can be seen relatively clearly with CC, at least in some cases.
Before we review a couple of examples, let’s consider what CC will show if two variables have no relationship. As an illustration, I created two synthetic data sets with random distributions and ran a CC analysis. (Wonk alert: for the associated analytics, I’m using the ccf function in R, the statistical software environment, here and throughout.) As the first chart shows, there’s no pattern here, even across a wide array of time lags. That’s no surprise, of course—by definition, data that’s randomly distributed has no relationship.
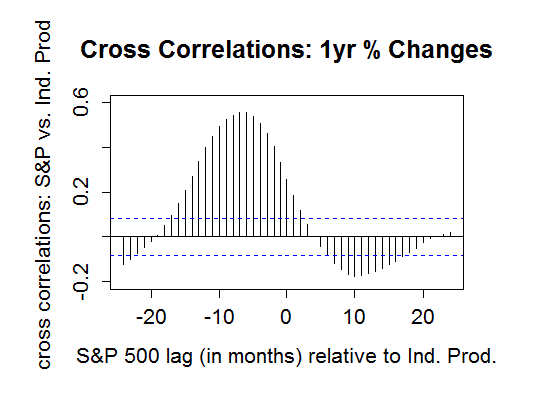
Now let’s look at some real numbers: the stock market (S&P 500) and US industrial production. Comparing 1-year percentage changes (based on the past 50 years) for each via CC shows that the correlation maxes out at around 0.6 at a monthly lag of 7 months for stocks relative to industrial production. (Correlation figures range from 1.0, which indicates perfect positive correlation, to zero or no correlation, to -1.0, which reflects perfect negative correlation.) In other words, the data here show that relatively high (low) one-year returns in the stock market today predict that industrial output in seven months will post significant one-year gains (losses).
Note that the relationship is weak when we look at the evidence that industrial production anticipates equity returns. This is shown by the comparatively low negative correlations to the right of the zero lag in the chart above. (The two blue dashed lines, by the way, show the critical values for the CC analysis at the 5% level. CC values above or below the blue lines suggest that there’s a statistically significant relationship between the two variables, i.e., we can reject the null hypothesis.)
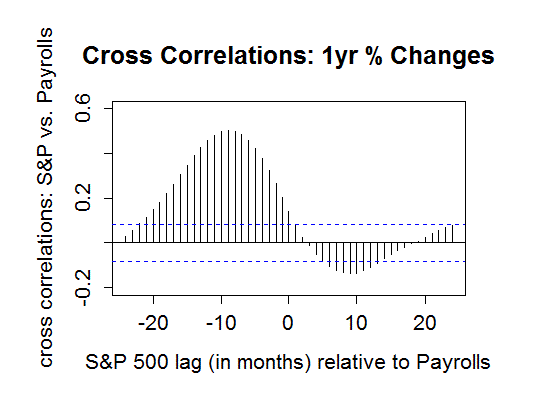
It’s important to note that not every pairing of market prices and economic activity reveals a meaningful relationship. But it’s also true that the stock market can help us project several key macro trends. Industrial activity is one example; employment is another, as the next CC chart shows. Once again, the numbers suggest that one-year changes in equities anticipate the one-year change in private payrolls.
Although looking for relationships between macro and markets can reveal a lot, there’s risk here. Any one pairing can be wrong at times, which is to say that the stock market isn’t flawless when projecting future economic activity. Indeed, the correlations above are roughly 0.6, or far enough under 1.0 to keep certainty at bay. That inspires looking at a range of economic and financial data to diversify the risk that any one set of numbers is misleading us at a particular point in time. (As an example, take a look at last month’s US Economic Profile.)
The big caveat is that predicting the future with today’s prices is only a partial solution. The future’s still uncertain and so an unexpected shock that surprises the crowd—a.k.a. an unknown unknown, black swan event or tail risk—can turn even the highest-quality forecast into garbage. But to the extent that real-time financial data can provide insight about what may occur in the near-term future, there are some intriguing relationships that are worth monitoring.


Pingback: Macro, Markets and Cross-Correlation – The Capital Spectator | Marty Investor