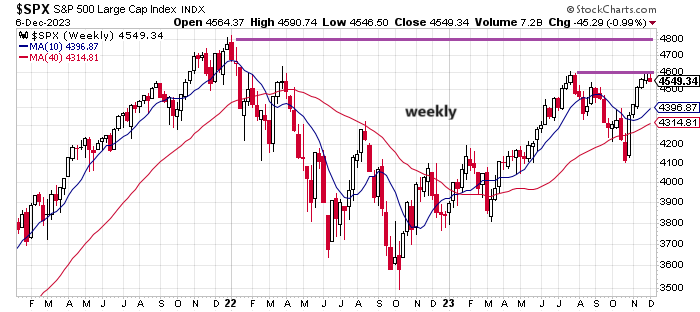
For much of the past month and a half the S&P 500 Index has rallied, recovering all of the lost ground from the summer/fall correction. The market is currently trading at just below its July high. A decisive rise above this level would strengthen the view that US equities are poised to break free of the trading range that’s prevailed for much of the past two years.
A weekly chart of the S&P offers useful perspective. Upside momentum has stalled at roughly the 4550 to 4600 range. Investors are wondering if this is a hard ceiling or a pause that refreshes and lays the groundwork for a resumption of the bullish trend that started more than a year ago.

The big prize is the January 2022 record high, which arrived just ahead of the Federal Reserve’s launch of the interest-rate hiking cycle that triggered sharp losses for stocks last year. Growing confidence in recent months that rate hikes have ended, and rate cuts are likely next year, is fueling the upside bias in equities.
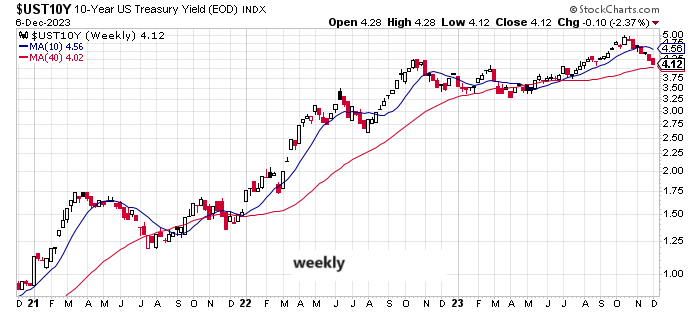
The trend for the benchmark US 10-year Treasury yield appears to be rolling over after several years of trending up. For much of the past two months this key rate has been sliding, closing at 4.12% on Wednesday (Dec. 6), the lowest since early September. Further declines would likely support higher stock prices.

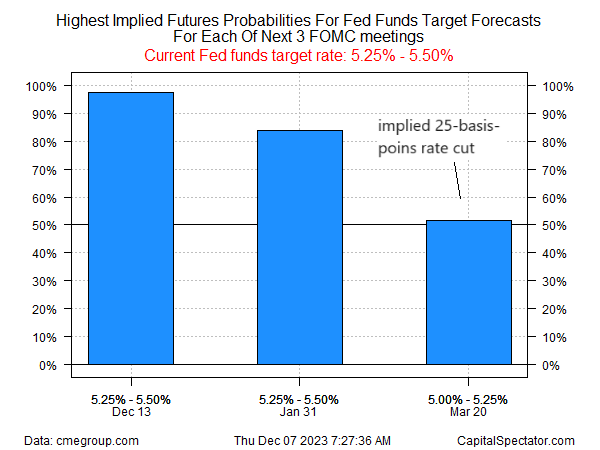
The path ahead for interest rates, in sum, will be a critical factor for determining if US stocks can break out of the recent trading range. Fed funds futures are currently pricing in slight odds that the central bank will cut its target rate 25 basis points in March. This is hardly a convincing case, but it does mark what appears to be a sentiment shift that anticipates the start of a dovish policy regime in 2024.

Although expectations for lower rates have provided support for stocks recently, there’s a possible downside, notes Quincy Krosby, chief global strategist for LPL Research. In a research note she advises that the recent drop in yields “is concerning as it reflects a slowing economic backdrop, but perhaps one that is deteriorating at a faster than desired clip.”
On that basis, a key question for equity investors: How long would sliding interest rates support higher stock prices? At some point, an ongoing decline in rates would be a signal of mounting economic trouble, or so one might argue.
On that note, the current GDP nowcast (as of Dec. 6) for the fourth quarter via the Atlanta Fed’s GDPNow model estimates output will decelerate sharply to 1.3% from the red-hot 5.2% rise in Q3.
So, how much a good thing (lower rates) is too much for animal spirits in the stock market? No one knows exactly, but the S&P’s prospects for breaking out of its trading range may be tougher than it appears if the slide in Treasury yields is driven by worries about softer economic activity vs. disinflation.
How is recession risk evolving? Monitor the outlook with a subscription to:
The US Business Cycle Risk Report