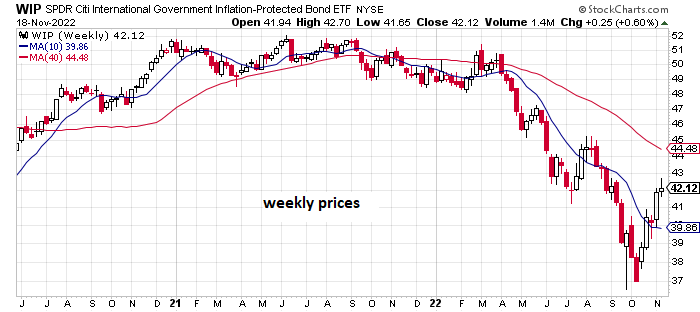
As markets continue to grapple with various macro risks, government bonds indexed to inflation ex-US extended their recent rally and posted the strongest gain last week for the major asset classes, based on a set of ETFs.
SPDR FTSE International Government Inflation-Protected Bond ETF (WIP) rose 0.6% during the trading week through Friday, Nov. 21. The increase lifted the fund to its highest weekly close in two months. Despite the increase, WIP’s price trend remains bearish, echoing the technical profile for most other bonds sectors at a time of rising interest rates and elevated inflation.

Overall, trading was mixed last week for the major asset classes. Foreign bonds posted the bulk of the gains. Losses, by comparison, were comparatively steep, pulling down prices developed markets (VEA), including the US (VTI).
Equities in emerging markets (VWO) bucked the trend for stocks with a fractional gain, marking the ETF’s third weekly advance. Nonetheless, the trend for VWO still looks bearish as it trades modestly above two-year lows.

The bias toward selling last week weighed on the Global Market Index (GMI.F), an unmanaged benchmark, maintained by CapitalSpectator.com. This index holds all the major asset classes (except cash) in market-value weights via ETFs and represents a competitive measure for multi-asset-class-portfolio strategies overall. GMI.F fell 0.6% last week (red line in chart below).

Turning to the one year trend, all the major asset classes remain under water for the trailing one-year window except for commodities (GCC).
GMI.F is also posting a one-year loss, closing down 16.9% vs. the year-earlier price.

Reviewing the major asset classes through a drawdown lens continues to show steep declines from previous peaks. The softest drawdown at the end of last week: US junk bonds (JNK), which closed with a 12.5% peak-to-trough decline. The deepest drawdown: foreign corporate bonds (PICB), which ended the week with a 28.8% slide below its previous peak.
GMI.F’s drawdown: -17.4% (green line in chart below).

Learn To Use R For Portfolio Analysis
Quantitative Investment Portfolio Analytics In R:
An Introduction To R For Modeling Portfolio Risk and Return
By James Picerno