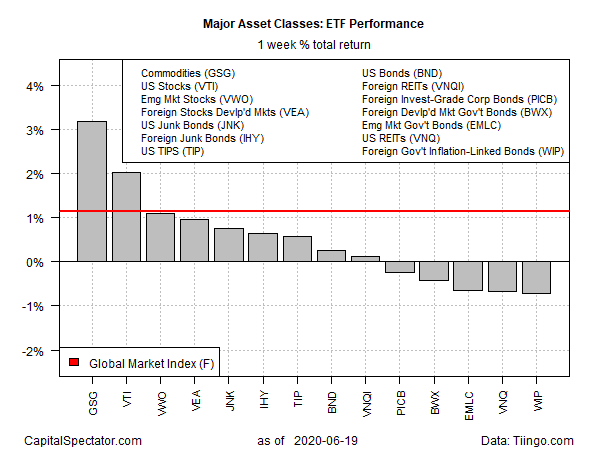
Broadly defined commodities and US shares posted the highest gains for the major asset classes during the trading week through Friday, June 19, based on a set of exchange-traded funds.
The top performer, by far: iShares S&P GSCI Commodity-Indexed Trust (GSG), which rose 3.2% last week. The gain marked the ETF’s seventh weekly advance during the past eight weeks.

Focusing on the tailwind of late for commodities, The Wall Street Journal today reports: “Prices for raw materials including oil and copper are surging as the world economy reopens for business, a signal to many investors that global growth is returning more quickly than anticipated.”
How is recession risk evolving? Monitor the outlook with a subscription to:
The US Business Cycle Risk Report
US equities were last week’s second-best performer for the major asset classes. Vanguard Total US Stock Market (VTI) rose 2.0%, closing near the highest level since the coronavirus crash in March.
Last week’s biggest loser: inflation-linked government bonds ex-US. SPDR FTSE International Government Inflation-Protected Bond (WIP) slipped 0.7%, the fund’s second straight weekly decline.
The major asset classes overall rose 1.1%, based on the Global Markets Index that uses exchange-traded funds (GMI.F). This unmanaged benchmark, which holds all the major asset classes (except cash) in market-value weights via ETFs, has posted gains in four of the past five weeks.

For the one-year trend, commodities continue to suffer the biggest decline. Despite recent gains, GSG remains deep in the red for the trailing 12-month window: a loss of more than 30%.
The biggest one-year winner for the major asset classes: a broad measure of investment-grade US bonds. Vanguard Total US Bond Market (BND) is up 9.0% after factoring in distributions.
GMI.F’s one-year return through Friday’s close: 3.1%.

Ranking asset classes via current drawdown continues to show a wide range of results, ranging from a 70% peak-to-trough decline for commodities (GSG) to the zero drawdowns for US investment-grade bonds (BND) and inflation-indexed Treasuries (TIPS).
GMI.F’s current drawdown: -5.9%.

Learn To Use R For Portfolio Analysis
Quantitative Investment Portfolio Analytics In R:
An Introduction To R For Modeling Portfolio Risk and Return
By James Picerno