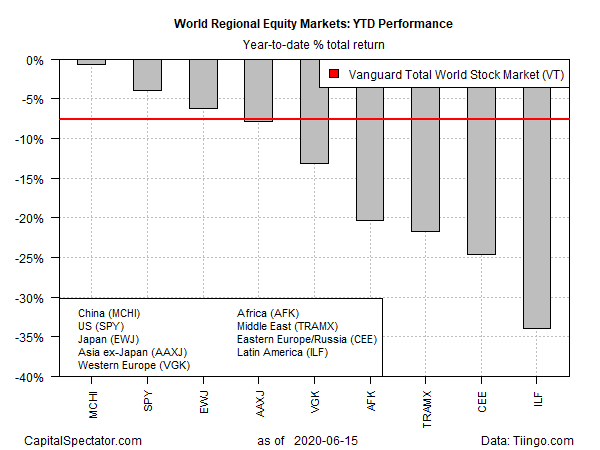
For much of the year so far, Chinese shares have held the lead for stock market returns, albeit by losing less than the other major equity regions, based on a set of US-listed publicly traded funds. For a brief period in late-May the leadership shifted to American stocks, but in recent days Chinese stocks are again leading as of trading through Monday, June 15.
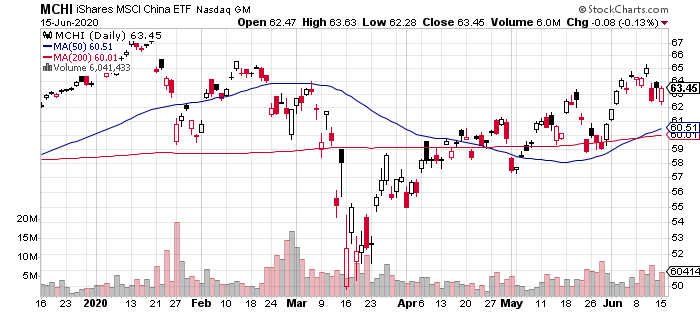
The iShares MSCI China ETF (MCHI) is the top year-to-date performer for the world’s major equity regions via a slight 1.0% loss. Although the fund, in line with the rest of the world’s stock markets, was pummeled in the coronavirus correction in March, MCHI has bounced back sharply and is close to levels that prevailed before the crisis roiled global markets.

US equities are a close second this year. SPDR S&P 500 (SPY) is down 4.0% in 2020 through yesterday’s close. But in the wake of extreme volatility in recent months, this is a trivial difference with MCHI. Perhaps the gap will close after the market digests news of a reported $1 trillion infrastructure stimulus proposal for the US economy that’s under consideration by the Trump administration.

Meanwhile, the hardest-hit equity regions this year continue to post deep losses. Notably, iShares Latin America 40 (ILF) is down nearly 34% so far in 2020. Africa, Middle East and Eastern European shares are also posting relatively deep year-to-date declines.
Learn To Use R For Portfolio Analysis
Quantitative Investment Portfolio Analytics In R:
An Introduction To R For Modeling Portfolio Risk and Return
By James Picerno
The global benchmark for equities, by comparison, is off a relatively modest 7.6% so far in 2020, based on Vanguard Total World Stock (VT).
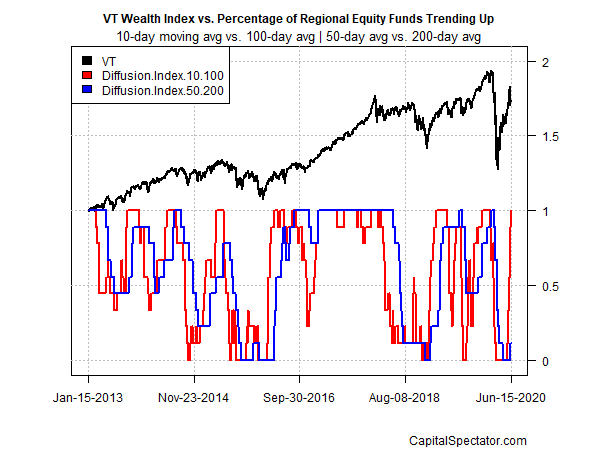
Meanwhile, there are hints that a general upturn in global equities will continue, based on profiling all the fund listed above through a momentum lens. The profile in the chart below is based on two sets of moving averages. The first measure compares the 10-day average with its 100-day counterpart — a proxy for short-term trending behavior (red line in chart below). A second set of moving averages (50 and 200 days) represent an intermediate measure of the trend (blue line). Using data through yesterday’s close shows that bullish short-term momentum overall has rebounded sharply across the board for the funds listed above.

How is recession risk evolving? Monitor the outlook with a subscription to:
The US Business Cycle Risk Report
Pingback: China Shares Have Held the Lead for Stock Market Returns - TradingGods.net