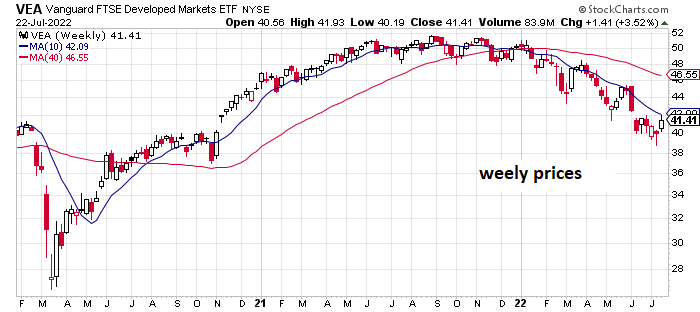
One solid weekly bounce doesn’t mean much after months of losses, but hope still springs eternal. Only time will tell if the latest bounce marks a turning point, or not. But for one week, at least, global markets delivered something other than gloom via a uniform rise in prices for the major asset classes over the trading week through Friday, Jul. 22, based on a set of proxy ETFs.
Developed equity markets ex-US posted the biggest bounce. Vanguard Developed Markets (VEA) surged 3.5%. Impressive, but the rise hardly puts a dent in the downside momentum that’s still running strong.

Otherwise, weekly gains lifted all the major asset classes. The softest gain: commodities. The broadly diversified WisdomTree Commodity ETF (GCC) rose 0.9% last week. Although relatively modest, the advance is notable as it’s the first weekly increase in six weeks for the fund.
The Global Market Index (GMI.F) also rallied last week with a solid 2.6% gain. This unmanaged benchmark, maintained by CapitalSpectator.com, holds all the major asset classes (except cash) in market-value weights via ETFs and represents a useful index comparison for portfolio strategies overall.

Despite widespread gains last week, the one-year profile of the major asset classes continues to skew broadly negative. The upside outlier is still commodities via GCC, which closed with a 10.0% increase on Friday vs. the year-earlier level.
Otherwise, all the major asset classes are underwater for the trailing one-year window. The deepest slide is currently with foreign corporate bonds (PICB) via a 22.2% loss.

Significant drawdowns continue to weigh on markets as of Friday’s close. The exception: inflation-indexes US Treasuries via TIP, which closed with a relatively modest 7.5% peak-to-trough decline. By contrast, the rest of the field reflects drawdowns below -10%. The steepest decline from the previous peak at the moment: a 29.4% tumble for government bonds issued by governments in emerging markets (EMLC).
GMI.F’s current drawdown: -16.9%.

Learn To Use R For Portfolio Analysis
Quantitative Investment Portfolio Analytics In R:
An Introduction To R For Modeling Portfolio Risk and Return
By James Picerno