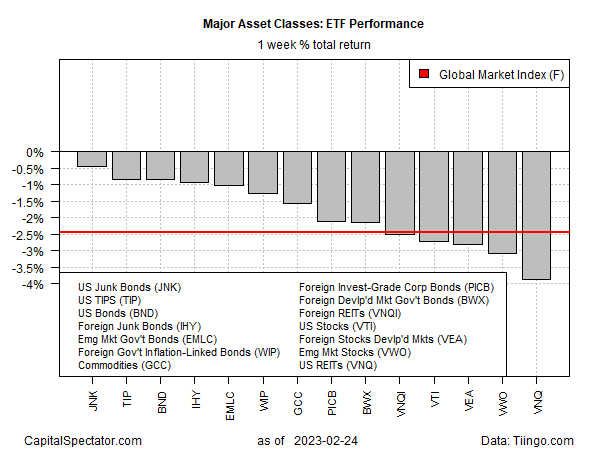
Sellers took a toll on all the major asset classes last week, based on a set of ETF proxies.
US junk bonds posted the softest setback in trading through Friday’s close (Feb. 24). SPDR Bloomberg High Yield Bond (JNK) edged down 0.4% for the week, marking the third straight weekly loss. Despite the recent declines, JNK continues to trade in a middling range based on prices for the past year.

The deepest loss last week: US real estate investment trusts. Vanguard Real Estate Index Fund (VNQ) tumbled 3.8%. As the fund price slides, it’s trailing one-year dividend yield rises and is currently 3.54%, according to Morningstar.com. But that’s still well below the 3.95% for the current 10-year Treasury yield, suggesting that the ETF is still vulnerable as long as the Federal Reserve continues to lift interest rates.
The market’s expectations for the Fed funds terminal rate “keeps getting pushed higher and higher,” says Al Bruno, associate portfolio manager for Morningstar Investment Management. “At the beginning of the year, the market was pricing in the Federal Reserve cutting interest rates by the end of the year, now that’s no longer the case.”
How is recession risk evolving? Monitor the outlook with a subscription to:
The US Business Cycle Risk Report
The policy-sensitive 2-year Treasury yield rose to 16-year high on Friday. The increase lifted this widely followed rate above the effective Fed funds rate, which is considered a sign that the market is now pricing in a higher-than-recently expected peak for the central bank’s terminal rate.

The Global Market Index (GMI.F) took a 2.4% hit in the latest selling wave, falling for a third time in as many weeks. This unmanaged benchmark holds all the major asset classes (except cash) in market-value weights via ETFs and represents a competitive measure for multi-asset-class-portfolio strategies.

All the major asset classes are now firmly under water for the trailing one-year performance. The declines range from the mild – a 4.7% slide for US stocks (VTI) – to the severe: a 19.0% loss for corporate bonds ex-US (PICB).
GMI.F is down 7.0% for the past year.

Comparing the major asset classes through a drawdown lens continues to show relatively steep declines from previous peaks. The softest drawdown at the end of last week: US junk bonds (JNK), which closed 11.0% below its previous peak on Friday. At the opposite extreme: corporate bonds ex-US (PICB) with a 19% drawdown.

Learn To Use R For Portfolio Analysis
Quantitative Investment Portfolio Analytics In R:
An Introduction To R For Modeling Portfolio Risk and Return
By James Picerno