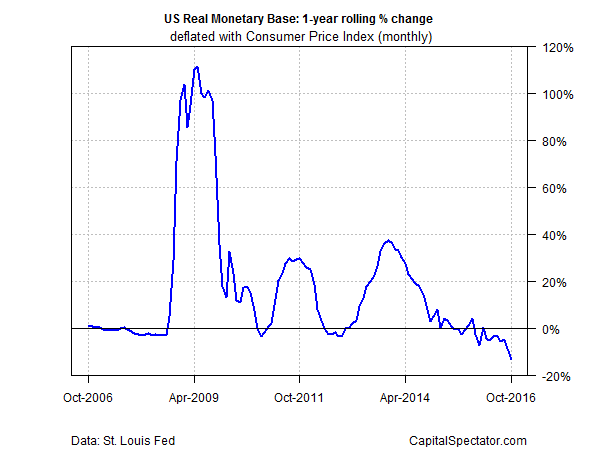
In another sign that the Federal Reserve is preparing to raise interest rates, the real (inflation-adjusted) M0 money supply’s decline picked up speed in October. The 13.4% year-over-year decrease is the steepest on record (dating to 1948) and marks a sharp drop from September’s 8.8% slide.
M0, which is also known as the monetary base and high-powered money, has declined for ten straight months through October (in year-over-year terms), the longest non-stop run of red ink in eight years. The difference this time: the contraction is significantly deeper than previous declines.
The current slide follows years of extraordinarily high rates of growth. But it’s clear that the monetary tide has turned and the Fed looks poised to announce another rate hike at its monetary policy meeting that’s scheduled for Dec. 13-14.
Market sentiment is expecting no less at the moment. Fed fund futures are pricing in a 94% probability that the central bank will lift its policy rate (currently at a 0.25%-to-0.50% range) at the FOMC meeting next month, based on CME data (as of Nov. 22).
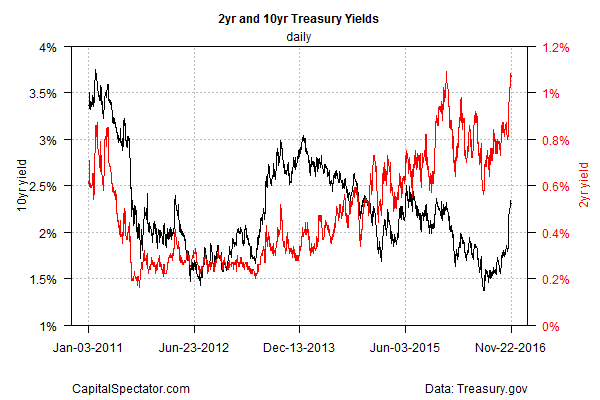
Treasury yields have shot higher too. The policy sensitive 2-year yield settled at 1.07% yesterday (Nov. 22), fractionally below the highest level so far this year, according to Treasury.gov data.
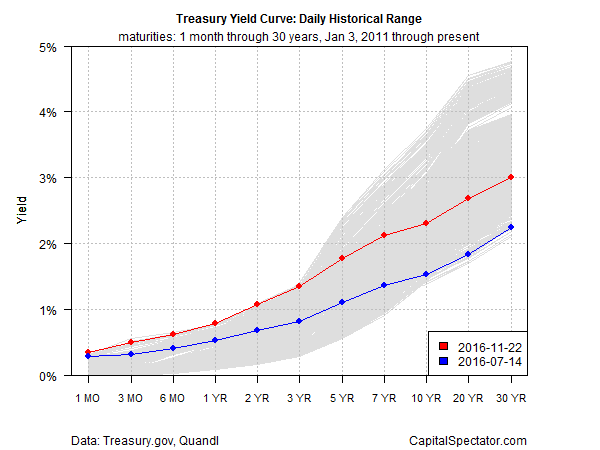
Meanwhile, the Treasury yield curve has steepened substantially in recent weeks. In particular, the short end of the curve is at or near the highest levels in recent years through 3-year maturities (see chart below). Overall, there’s been a clear shift higher in the curve compared with yields from 90 trading days earlier (shown in blue).
“After the Trump Shock, it’s easy for the Fed to hike, because inflation expectations have gone up,” advises Hideaki Kuriki at Sumitomo Mitsui Trust Asset Management in Tokyo. He tells Bloomberg that he’s “100 percent” certain that the Fed will raise rates next month.
Ten-year inflation expectations ticked up to 1.75% in this month’s update via the Cleveland Fed’s model, but that’s still a middling pace compared with the numbers so far this year. The Treasury market’s implied inflation estimate, however, is on the march, rising in recent days to ~1.90%, the highest level in more than a year (based on the yield spread for the 10-year nominal Note less its inflation-indexed counterpart).
Peter Boockvar of The Lindsey Group observes that inflation is also firming up outside of the US.
The 5 yr euro inflation swap that Draghi claims to watch is trading at its highest level since January. If oil prices continue rising, there is a lot of room to the upside here… With the rise in commodities where the CRB raw industrial’s index is at the highest level since January 2015, the seeds for this have been sown over the past year with the dramatic cut in mining investment.
The pressure on the Fed to act, in sum, is rising. Short of dramatically dark economic news in the days ahead, it’s appears that the die is cast for squeezing policy on Dec. 14. A sharp slowdown in employment growth in the November report scheduled for next week (Dec. 2) could trigger another delay. But based on what we know right now, Yellen and company look set to pull the monetary trigger for the second time since the last recession ended.


Pingback: Another Sign the Federal Reserve Is Preparing to Raise Interest Rates - TradingGods.net
Pingback: Wednesday links: nowhere near the end | Viral Investor
Pingback: Artikel über Wirtschaft und Devisen 27. Nov. 16 | Pipsologie
The question I would have is: if the draining of liquidity sparks a rout in the stock market, will the Fed stay the course? Or will they lose their nerve and inject liquidity once again (as they did after the January 2016 market drop)?
Nick de Peyster
undervaluedstocks.info