Correlations between asset classes have been trending up lately, a directional bias that could be a warning sign, according to several market observers.
Michael Harris at the Price Action Lab Blog yesterday advised that “the 60-day stock-bonds correlation spiked this month from about -0.50 to +0.20. A similar spike occurred mid-2007 and just a few months before the stock market top.”
Another way to analyze the stock-bond correlation is by looking at the relationship between bond yields and equities. Since yields move inversely to bond prices, a negative correlation between yields and the stock market implies a tighter correlation between the two asset classes with prices. With that in mind, veteran market observer Marc Chandler sees the potential for trouble brewing. He noted last Friday on his blog Marc to Market that the correlation between the 10-year Treasury yield and S&P 500 on a rolling 60-day basis “is now inverse (-0.15) for the first time since the April-June 2015 period.” In other words,
the previous relationship has broken down. This is a warning sign to investors of a potential shift in the investment landscape. There have only been three periods since the beginning of 2009 that the correlation between the change of the S&P 500 and the change in the 10-year yields has been inverse: now, the two-month period last year and a six-month period that in bounced in and out of inversion in the second half of 2013.
Reuters last week reported that “stocks and bonds are moving in lock-step more than at any time since the financial crisis, making life difficult for asset allocators and driving investors into the one asset guaranteed to bring zero return — cash.”
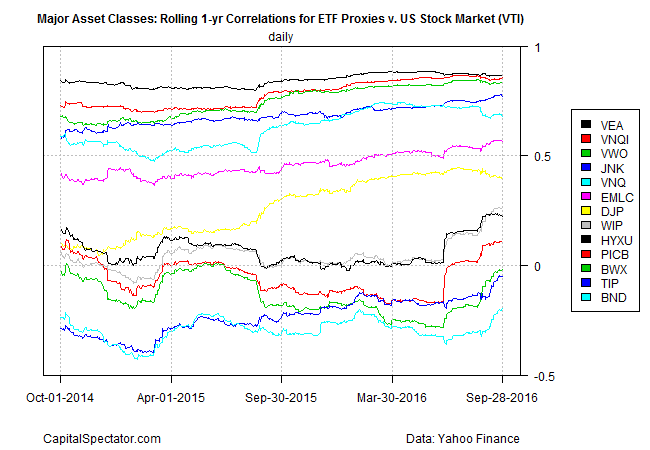
For another perspective, let’s review correlations between an ETF proxy for the US stock market — Vanguard Total Stock Market (VTI) — and the remainder of the major asset classes based on representative ETFs via rolling one-year returns on a daily basis. As you can see in the first chart below, there’s an upward drift in the correlations. The upside bias includes the correlation between between US stocks and bonds, as depicted in the light-blue line at the bottom of the chart, which reflects the relationship between VTI and Vanguard Total Bond Market (BND). (Note: a 1.0 reading reflects a perfect positive correlation; zero is no correlation; -1.0 indicates a perfect negative correlation.)
Calculating the average correlation for all the major asset classes via the ETF proxies in the chart above shows an upside bias generally over the past year. As of yesterday (Sep 28), the average correlation for rolling one-year returns: roughly 0.4, which is nearly double the level from the first quarter of 2015.
The good news is that an average correlation of 0.4 for the major asset classes implies that the benefits of diversification across markets are still intact. The case for broad asset allocation would break down if assets routinely posted correlations close to 1.0, but that’s unlikely to happen any time soon if ever.
But as William Bernstein advised in an e-book a few years ago, correlations may be destined to rise due to indexing’s growing popularity. “The average investor can build and manage multi-asset class portfolios to a degree that was once the exclusive province of institutions,” he explains in Skating Where the Puck Was: The Correlation Game in a Flat World . “As a result, the low-hanging fruit of low correlations has probably been picked.” If so, designing and managing asset allocation strategies and extracting satisfying results could become tougher in the years ahead.
Recent history appears to support Bernstein’s thesis. That doesn’t mean you should abandon asset allocation, although it may be timely to manage expectations down a touch about what multi-asset-class diversification can deliver in the years ahead.


Pingback: 10/03/16 – Monday’s Interest-ing Reads | Compound Interest-ing!
Pingback: Research links: exploitable anomalies | Viral Investor