In some quarters, forecasts of sharply higher inflation in the US have become a perennial warning since the Great Recession ended in mid-2009. The Federal Reserve’s extraordinary efforts with monetary stimulus, the reasoning goes, is destined to unleash runaway inflation any day now. Those expectations have yet to align with the hard numbers. But in the wake of last month’s surprisingly strong payrolls report, the inflation hawks have a fresh set of talking points to discuss. Is it really different this time? For some insight, let’s review the historical relationship between inflation and wage growth.
The notion that higher wages are a key factor for raising inflation is widely accepted as a general proposition. The empirical record, however, is mixed, especially in the short to medium term. “Wages and prices are closely related,” a research note from the San Francisco Fed noted last year. But the historical relationship between the two variables isn’t sufficiently strong to conclude that looking at wages alone tells you everything that you need to know for modeling the future path of inflation.
But let’s throw caution to the wind and review how wages relate with headline inflation in recent history and over the last half century. For proxies, let’s use year-over-year percentage changes for two data sets: the consumer price index and private-sector wages.
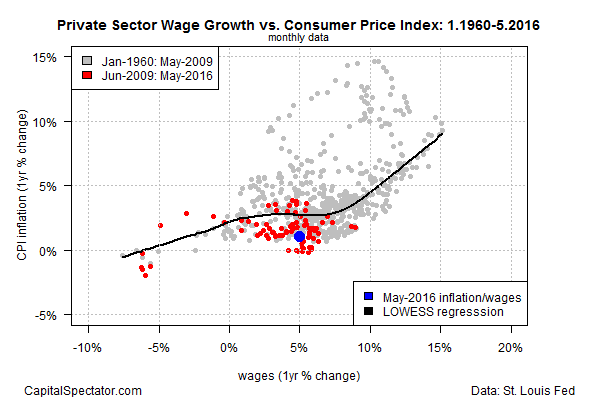
In the first scatterplot below, there’s a positive correlation between the wages and inflation from 1960 forward. But note that the relationship since 2009 (red dots) shows that inflation has been subdued relative to what you’d expect based on a longer-term view of the historical record. Overall, annual wage growth between zero and 5% has been a weak catalyst for higher inflation. The relationship appears to change when nominal wage growth exceeds 5%. Above that pace, the wage growth has shown a stronger connection with higher inflation, as reflected in the sharper upward slope of the trend line shown in black.
But note that in the few instances when wage growth has exceeded 5% after 2009 (red dots), inflation has remained relatively soft in terms of what the historical record implies. It’s unclear if this is noise or evidence of “secular stagnation,” as Larry Summers argues. In any case, annual wage growth through May 2016 was 5%, a middling pace vs. recent history. Inflation, however, remained comparatively weak, rising a bit more than 1% in annual terms.
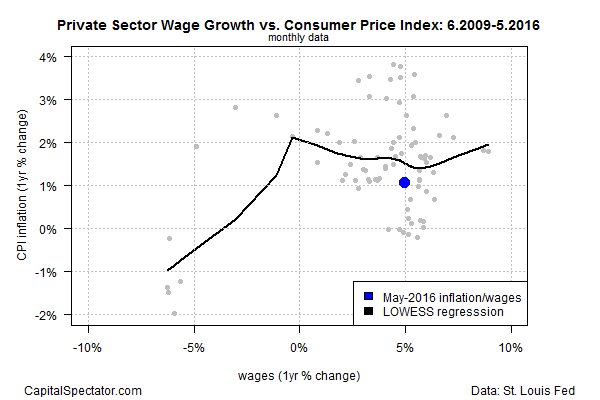
Let’s drill down into what may be a shifting relationship between wages and inflation in the wake of the Great Recession. The next chart plots the relationship between the two variables since June 2009, the last month of the recession the first month after the recession ended, according to NBER. Note that the positive relationship that’s evident in the chart above has turned flat since 2009 for periods when annual wage growth is positive. The factors that produced this result may or may not be temporary, but for the moment the change is striking. Taken at face value, the numbers suggest that nominal wage growth at 5% or higher is unlikely to trigger substantially higher inflation.
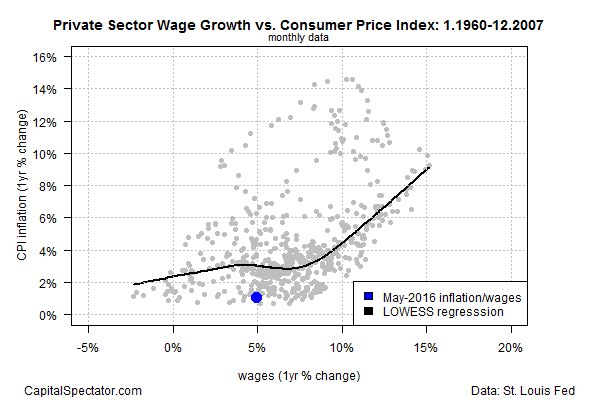
For perspective, consider the relationship between wages and inflation before the arrival of the Great Recession. It’s clear that a strong, positive relationship between the two prevailed as wage growth accelerated above 5%.
It’s unclear if the subdued inflation rate since 2009 is a new, permanent feature of the “new normal” economic landscape, or just a temporary trend that will eventually give way to the historical relationship that prevailed before the Great Recession. Nonetheless, the case is still appears weak for expecting a sharp rise in inflation any time soon.


Pingback: Is Inflation on the Horizon? - TradingGods.net
Pingback: 07/19/16 – Tuesday’s Interest-ing Reads | Compound Interest-ing!