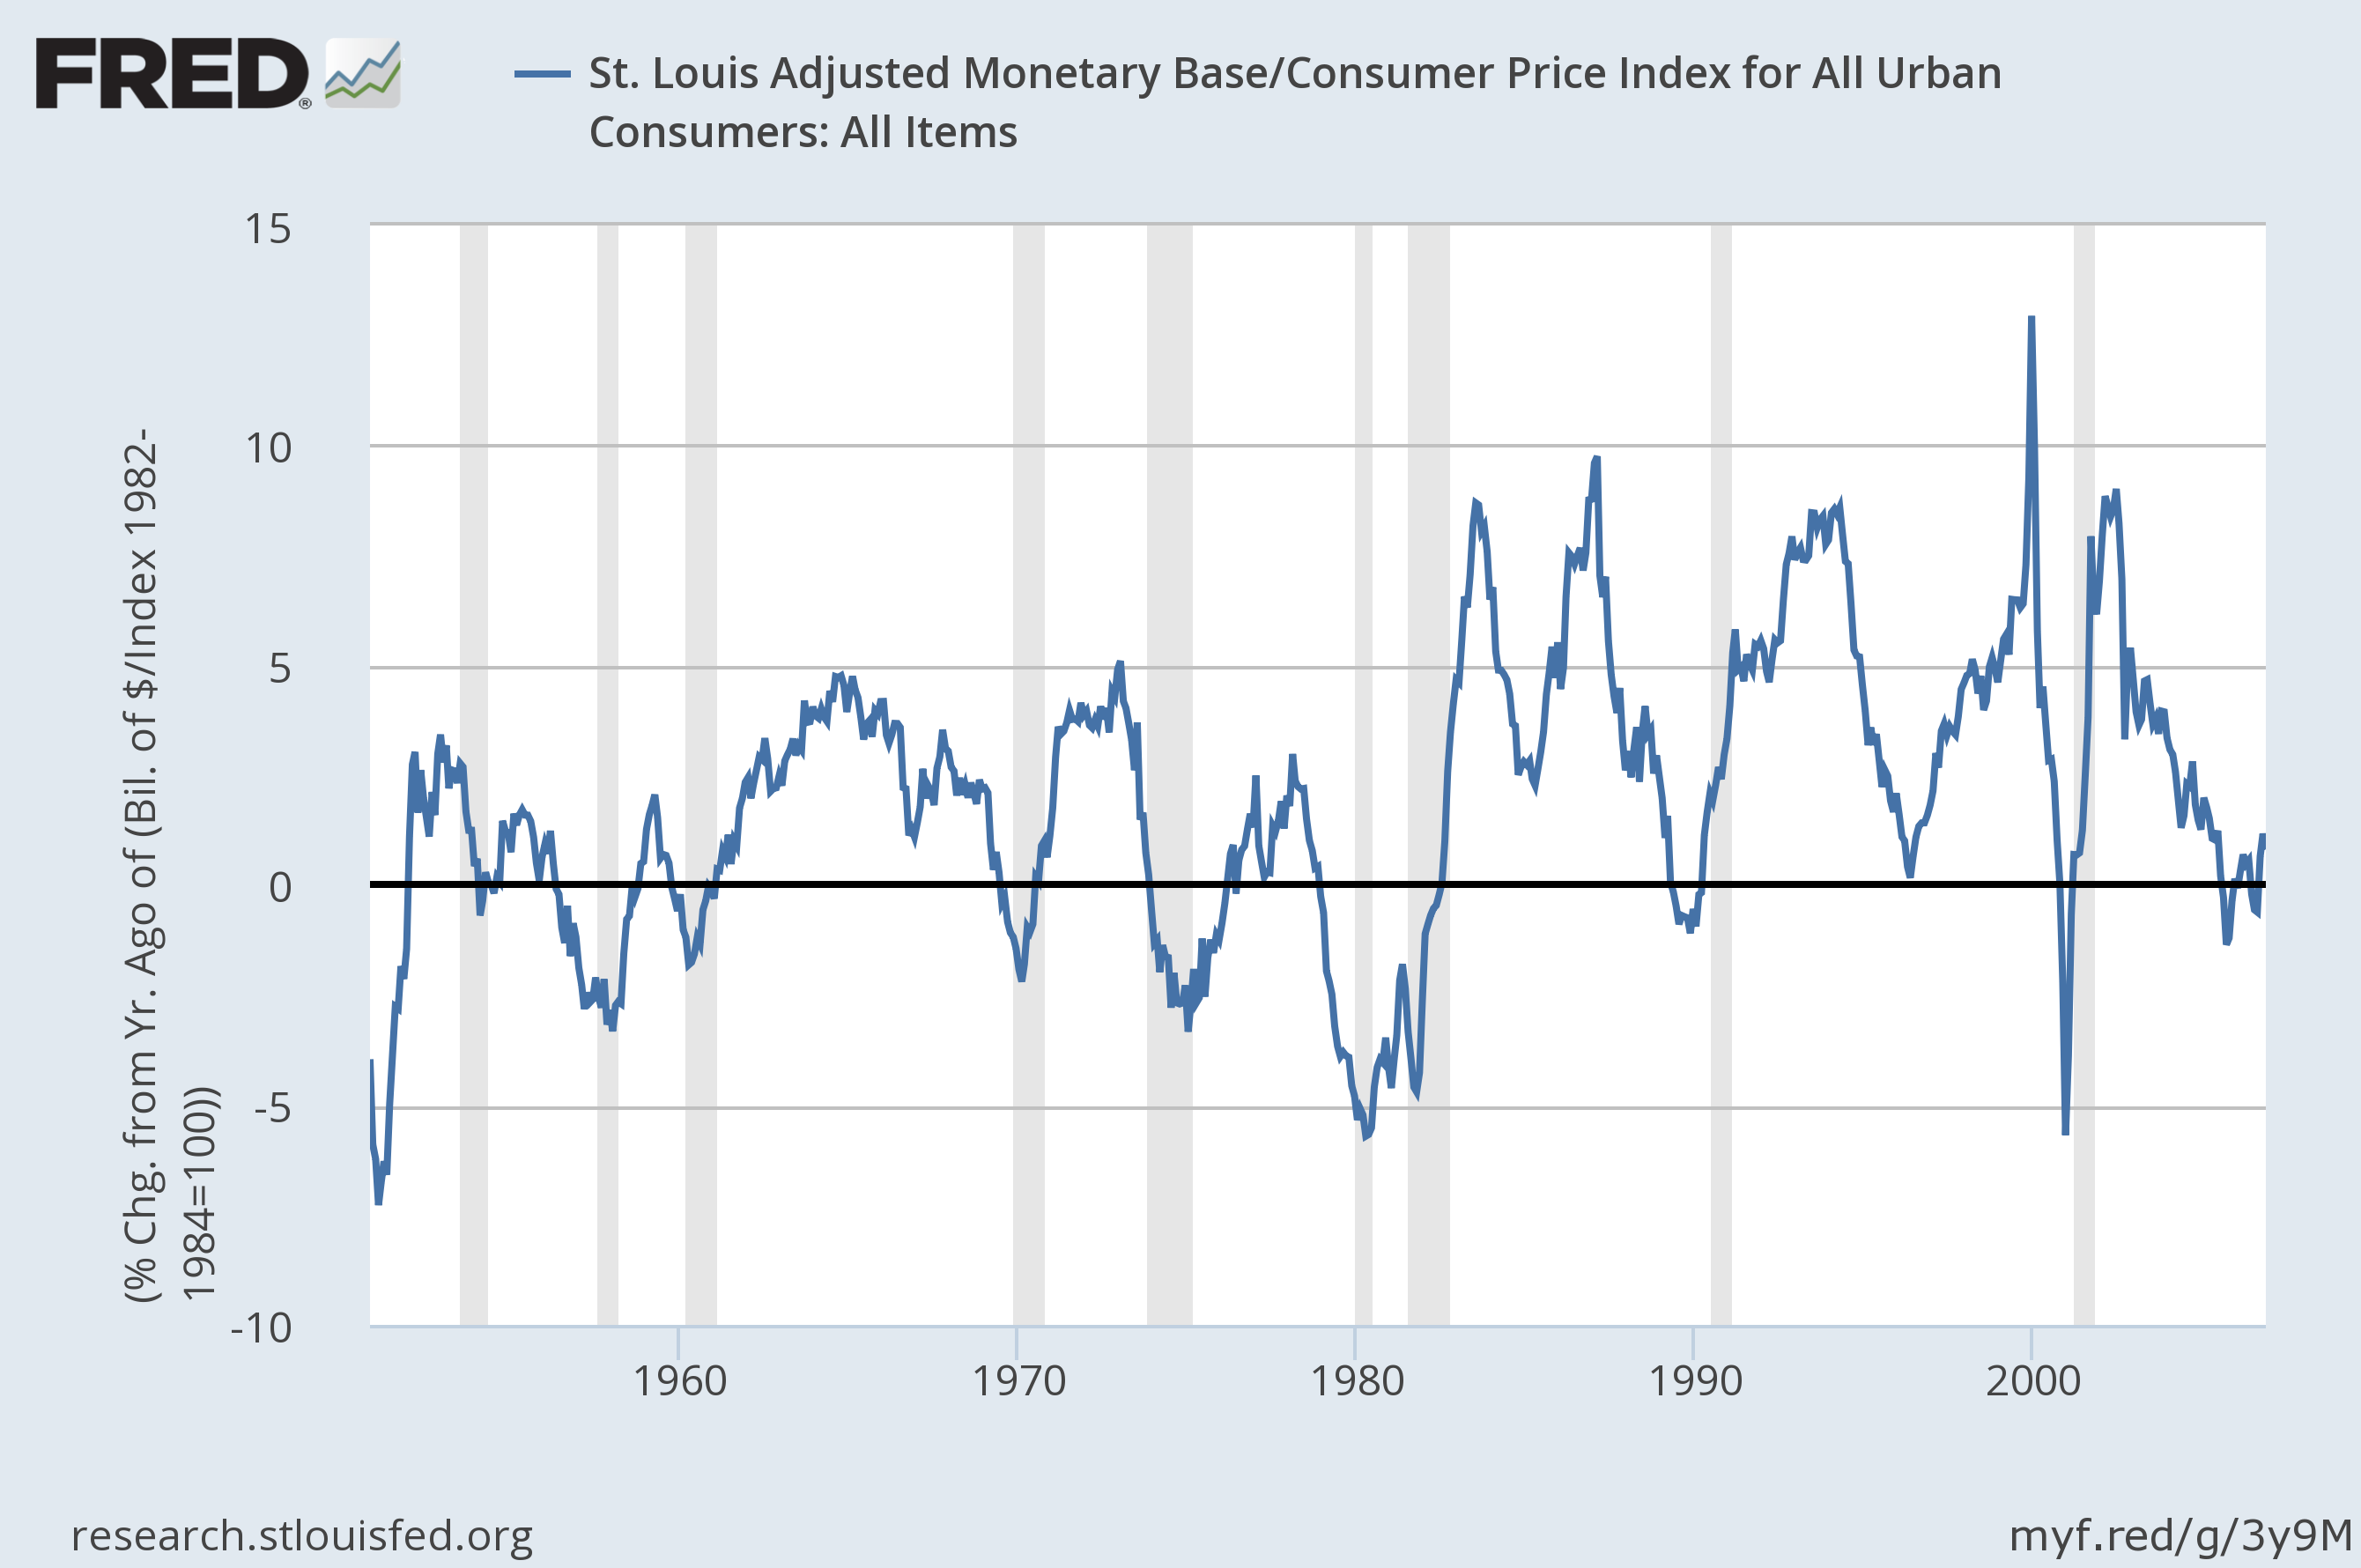
US monetary liquidity in January contracted at the sharpest rate in decades, according to the real (inflation-adjusted) year-over-year trend in base money (M0). It’s debatable if this alone is a warning sign for the macro outlook, but it’s an indicator that just went ballistic.
It’s always dangerous to reason from one set of numbers—even a crucial one like monetary policy. But neither is it wise to ignore a critical indicator when it goes to extremes. That certainly characterizes M0’s annual change through January. Indeed, real base money (the St. Louis Adjusted Monetary Base deflated by the consumer price index) contracted by 7.2% last month vs. the year-earlier level—the lowest since 1948!
The good news is that last month’s economic profile for the US looks encouraging. Yesterday’s update of three-month average of the Chicago Fed’s National Activity Index rose to a four-month high in the kick-off to 2016. Although the macro trend continues to roll along at a pace that’s below the historical trend, the odds are low that a new recession started in January, according this benchmark. That offers some comfort for thinking that the moderately positive bias will spill over into months ahead. But there are still reasons to be cautious, and you can add monetary policy by way of base money to the list.
It’s no surprise to see that the rare instances of negative changes in real M0 tend to coincide with recessions. Will it be different this time? Perhaps. After all, ours is a period in time when everything related to macro seems to be different. History, however, is relatively clear. (Note: the chart below ends in 2007 for easier historical viewing due to dramatic changes in M0 after 2008, which sharply expands the y-axis scale.)
Let’s recognize that there are other aspects of monetary policy trending positive—the Treasury yield curve in particular is still upwardly sloped, which implies that the near-term outlook still favors growth. Meanwhile, the current US GDP projection for the first quarter is solidly positive, based on the Atlanta’s Fed’s recent nowcast (as of Feb. 17). In addition, the Philly Fed’s ADS Index (based on data through Feb. 13) continues to point to a robust expansion for the foreseeable future.
It’s also possible that the current negative M0 signal isn’t relevant this time due to the extraordinary stimulus in recent years. In other words, perhaps policy is simply mopping up some of the dramatic excess liquidity that’s prevailed post-2008 and so the current tumble is misleading.
In any case, the question now is whether the bearish turn in the M0 trend threatens to reverse the encouraging signals in the rear-view mirror? For the moment the only reasonable answer is that there’s a new risk factor in town and it deserves close monitoring. Keep in mind that the Federal Reserve could, at its discretion, quickly reverse the negative trend via a new round of stimulus. Whether that happens, or not, and whether it matters for the macro trend at this late date, is open for debate.
Meantime, monetary policy’s influence on the big picture, for good or ill, is set to remain a key factor for deciding what happens next. As usual, I’ll be monitoring the numbers in The Capital Spectator’s monthly economic profile (and throughout each month via The US Business Cycle Report).
For the moment, the broad picture still looks encouraging. The question is whether M0 is about to tip the scales over to the dark side?


Pingback: US Monetary Liquidity Contracted in January