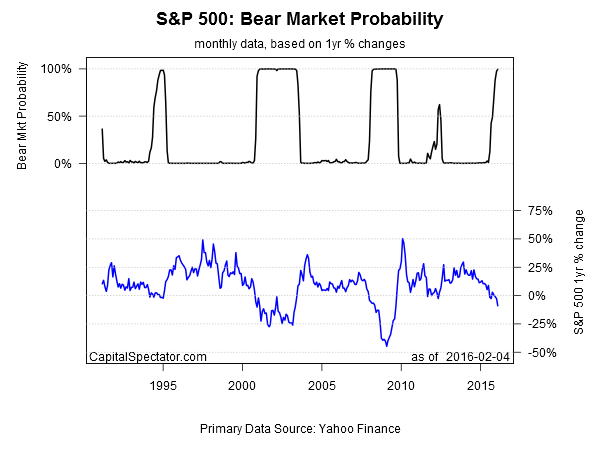
What does a bear market for the US equity market look like? Current conditions seem to fit the bill. The clues, after all, are piling up, including the early warning that’s still in progress via a relatively reliable quantitative tool—the Hidden Markov model (HMM). This is old news, of course, which means that it’s time to focus on early signs that the bear has run its course. Yes, it’s still early in the game on that score. But recognizing that the market’s bullish tide has probably turned leads to the obvious questions: What will a bottom look like and when will it arrive? No one really knows, but the toolkit that helped identify the start of a bear market will serve us well in the search for the seeds of a new bull market down the road.
Meantime, let’s review where we are via the prism of HMM (for design details, see this post; for its recent track record, see here). Recall that last October the case for calling a bear market in US stocks was signaled, according to this econometric lens. As I noted at the time, the data was “telling us that US equity trend (S&P 500) is in a bear market—a regime shift that started on Aug. 26 [, 2015] and remains in effect, according to this indicator.” I revisited the topic last month, and the numbers looked no less striking for arguing that downside risk was rising.
Fast forward to the here and now and HMM’s negative stance remains intact through yesterday, Feb. 4. The current estimate advises that there’s a near-certainty that a bear market is in progress. The 99.7% probability that we’ve hit regime shift head on is as decisive as this model can be. Peering into the future is always risky. But unless you can point to convincing quantitative evidence to the contrary, the HMM numbers paint a credible picture of the current trend. That doesn’t mean that prices will fall sharply or consistently. But there’s a new bias in town, according to this model, and so there’s a stronger case for adjusting risk exposures generally.
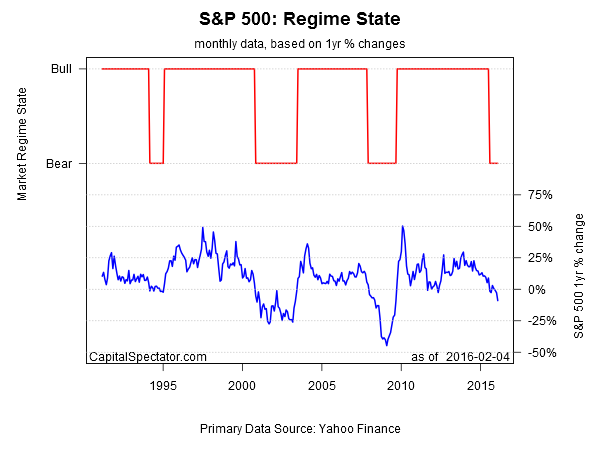
Here’s how the profile stacks up when crunching the numbers in a binary format—risk on or off.
It’s worth reminding at this point that HMM’s estimate isn’t an outlier event. Corroboration for the bear-market profile can be found in other econometric corners, including the negative momentum that’s showing up in moving averages these days. For instance, the S&P 500’s 50-day average is well below its 200-day counterpart—a state of affairs that prevailed for all but a handful of days since last September. A quantile-based review of the market’s trend also points to elevated downside risk. (1)
Nothing is certain when it comes to divining the future, of course. On that note, an acceleration in US economic growth could derail the bear market call and deliver a revival in equity prices that makes mincemeat of the analysis above. For the moment, however, the macro outlook is cloudy. Although there’s still no evidence across a broad spectrum of indicators for declaring that an NBER-defined recession has started, growth has turned weak lately and there are several wobbly developments that may prove to be decisive. Depending on how the macro updates break in the weeks ahead, the case for arguing that US equities have slipped into a bear market will strengthen or weaken.
It’s all par for the course when it comes to real-time analysis. That’s why going to extremes in matters of asset allocation is almost always a poor choice. Building in the possibility of being wrong in our analysis should be a staple for every portfolio design.
Meantime, it’s also clear that market risk is elevated, as it has been for some time. The bottom line: the case for paring back on equity exposure still looks reasonable. Selling into rallies, in other words, has above-average appeal in the current climate—if you’re inclined to manage money with a tactical bias.
Keep in mind that the same tools that provide clues about the onset of a bear market will remain useful in the search for early signs that a bullish bias is returning. There’s not a lot of support for that upbeat outlook at the moment, and it’s not clear that positive change will emerge in the number crunching any time soon. But nothing lasts forever, including bear markets.
(1) Based on a simple 10-day moving average of the S&P 500 in connection with the historical record. The premise here is that when the current moving average falls below the 5th percentile (based on the trailing 252-day period) of the moving average, downside risk is elevated.


Pingback: 02/05/16 – Friday’s Interest-ing Reads | Compound Interest-ing!