The US stock market has had a rough ride over the last three months. But if you averted your eyes from the volatility that started after Aug. 18 and checked the S&P 500 as of yesterday’s close (Nov. 10) it appeared that nothing much had changed. The fractional loss looks uneventful and so one might wonder what all the fuss was about? There’s been an enormous among of churning in the market since mid-August, but for the moment the dust has settled and from the perspective of the S&P 500 we’re right back where we started.
Equity performance has essentially been flat since mid-August, raising the obvious question: Has the danger passed? For the moment, yes. In fact, my 10-factor US Stock Market Crash Risk Index (CRI) has receded into a non-threatening posture after a brief but borderline flirtation with an all-out sell signal on a few days in August and September, as the chart below reminds.
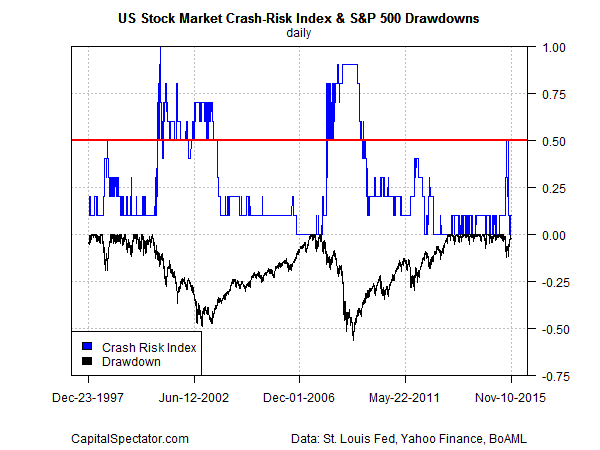
For some historical perspective, here’s how CRI stacks up since 1997:
Note that despite the recent period of turbulence this multi-factor measure of stock market risk never ventured above the 0.5 mark, which would have been an ominous sign. The tipping point was briefly reached on a handful of days—once in August and for two straight days in late-September, when CRI touched 0.50. It was tempting at the time to assume the worst and run for the hills. But the inability of CRI to rise decisively above the 0.5 mark (or even remain at that midway point for more than a day or two) left room for doubt that the end-of-the-world call from some corners was the genuine article.
The message is that the market suffers periods of elevated risk from time to time–periods that can but rarely turn into sustained bear market and economic recession. Recognizing the difference in real time isn’t easy, but we can and should make informed estimates by intelligently reviewing the numbers.
Recall that on Sep. 24, just days before CRI would make its second run up to 0.5, I considered what might constitute a clear signal that it was time to embrace a full-blown risk-off posture. The reluctance of CRI to rise decisively above 0.5 offered a degree of comfort. But if the bull market was truly over, the case would be clear via a deteriorating US economy. As I wrote at the time:
Deciding if the jig is truly up probably relies on whether the US economy stumbles. The available economic numbers overall still point to growth, albeit at a modest rate at best.
As it turned out, the macro trend has remained wobbly but positive, as the ongoing updates on these pages have consistently revealed. In mid-October, for instance, I noted that the data told us that “Mr. Market’s cautious outlook of late is less acute at the moment relative to recent history, but it’s not obvious that all’s well.”
Despite the case for caution, the real-time monitoring of business-cycle risk never delivered the final blow. On Oct. 21 the hard numbers continued to point to low recession risk. The trend had decelerated, I observed at the time, but it was also clear that “making the leap from a lesser rate of growth to an NBER-defined recession for the US remains an act of speculation—and one with minimal support in the numbers published to date.”
To bring this up to date, yesterday’s review (Nov. 10) of the US business cycle continued to point to a relatively low-risk environment.
To be fair, no methodology is flawless and so it’s important to recognize that the possibility of signal failure is always present. That said, the last three months have provided a stress test for CRI and the various recession-risk techniques that CapitalSpectator.com has developed in recent years. The scorecard so far is encouraging. In particular, the fact that CRI never ventured above the halfway mark of 0.5 and the lack of a real-time recession signal offered support for anticipating that the market and the economy would muddle through the recent rough patch.
Yes, that upbeat view could change, which is a reminder that ongoing vigilance is essential. But no less important is having the right tools at your disposal. History suggests that developing comparatively reliable signals requires analysis of a robust mix of indicators for the task at hand. Whether it’s economy or the markets, cherry picking data sets and letting the perm-bears influence your outlook is a recipe for disaster.
There are countless metrics available for review, but every one of them fails at some point. The good news is that it’s highly unlikely that we’ll see across-the-board failure at the same time if—and this is critical—you’re looking a diversified set of indicators.
So, what could go wrong? The main threat to the best-laid plans for risk analysis in macro and markets is the exogenous factor. Bolts from the blue can and do happen, which means that some hazards can’t be tracked in the numbers.
Otherwise, the data offers a valuable resource for cutting through the noise. Assuming, of course, you’re looking at a representative cross section of the relevant risk factors.
Another lesson from all this is the value of routinely looking at risk through a relatively objective econometric lens. It’s well-established that humans are susceptible to letting our emotions get the best of us, particularly during high-stress periods. A well-designed computer algorithm, by contrast, remains tirelessly focused on the facts. That doesn’t mean that we should turn over every aspect of risk analysis and money management to code. But attempting to make sense of the chaos in macro and markets without the aid of computer-based modeling is almost certainly destined for failure.

