Asset allocation is second to none in the hierarchy of critical investment decisions, but benchmarking and general analysis in this space can be a slippery affair. That’s no surprise, since portfolio design and management deserves to be customized for each investor. But while asset allocation is largely an insular project, keeping an eye on how these strategies are faring generally is a useful exercise in the cause of developing perspective. With that in mind, I’ll be checking in on a set of asset allocation funds from here on out as an excercise for monitoring and evaluating this critical corner of the money game. As such, it’s really an excuse to kick the tires on a mix of techniques for evaluating portfolios generally.
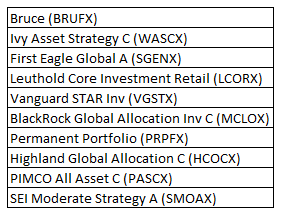
To keep things simple, I’ve chosen ten funds that represent a cross section of products in this space. The choices are semi-random, but the resulting group reflects a range of results and styles, incorporating a mix of aggressive tactical applications to conventional strategies that serve as a gateway for a quasi-passive mix of the usual suspects. Let’s label this motley group the AA-10. No one should consider the list as an endorsement of these funds per se; rather, the goal is simply to track a broad mix of asset allocation strategies in search of insight into this corner of asset management, with an emphasis on delving into the finer points of portfolio analytics. As such, I’ll be checking in on these products from time to time, reviewing risk and return from a variety of angles. Meantime, let’s start with the basics:
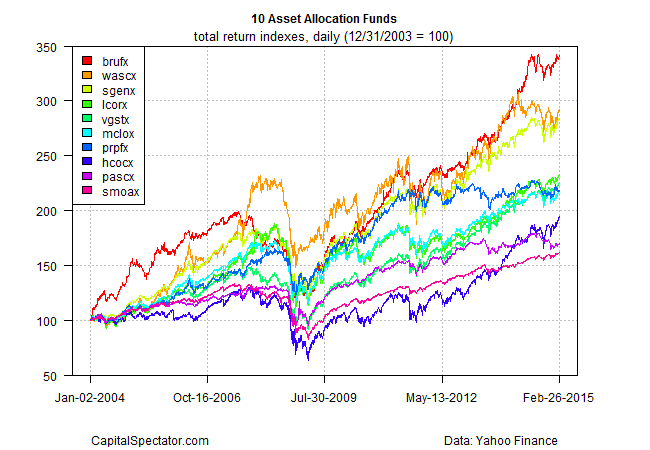
Here’s how the funds stack up in performance terms (total returns), based on $100 investments in all ten funds at the close of 2003 through yesterday (Feb. 26). Clearly, there’s a wide variety of results, offering a reminder that asset allocation, while simple in concept, delivers a rainbow of outcomes in practice.
It’s tempting to assume from the chart above that the top performer is the superior fund, but that’s not necessarily so until you understand the risks that were embraced (or not) to generate the returns. I’ll be examining those aspects along various dimensions in upcoming posts, but for now let’s start with a staple for risk evaluation: drawdown. In particular, consider the extremes, starting with the fund (hcocx) that suffered the biggest drawdown based on daily data over the sample period depicted in the chart above.
        From     Trough         To   Depth Length To Trough Recovery
1 2007-10-15 2009-03-09 2013-01-04 -0.5151   1316       352      964
2 2014-07-31 2014-10-15 2014-11-25 -0.1137     83        54       29
3 2005-12-15 2006-06-13 2006-10-04 -0.1020    202       123       79
4 2007-07-20 2007-08-16 2007-10-01 -0.0814     51        20       31
5 2004-03-08 2004-08-06 2004-11-04 -0.0705    169       106       63
The nearly 52% drawdow noted above was also brutally long.
At the opposite extreme is prpfx’s relatively mild 27% drawdown (see below), which was relatively brief by the standards of the AA-10.
        From     Trough         To   Depth Length To Trough Recovery
1 2008-05-21 2008-11-20 2009-10-08 -0.2717    350       129      221
2 2013-02-04 2013-07-05 2014-06-19 -0.1035    347       106      241
3 2006-05-12 2006-06-13 2006-11-29 -0.1031    140        22      118
4 2011-07-27 2011-10-03 2012-02-02 -0.0917    132        48       84
5 2004-04-02 2004-05-10 2004-09-28 -0.0880    123        26       97
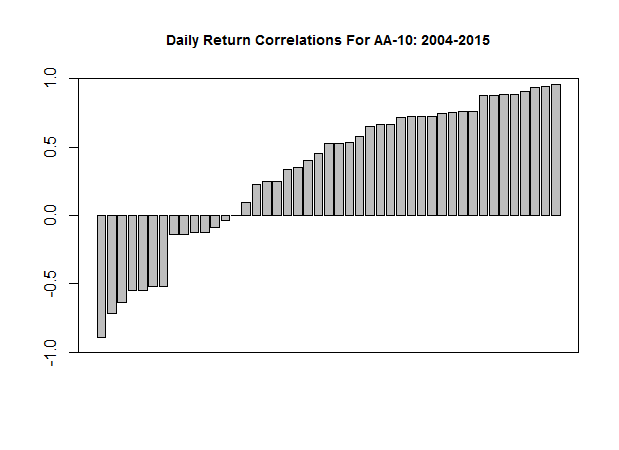
Reviewing return correlations since 2004 across the various combinations of AA-10 funds further highlights the fact that these products have little in common beyond the loose label of asset allocation strategies. With 10 funds there are 45 unique pairings for comparing performance correlations, and the resulting range is quite wide—from -0.72 for brufx/prpfx (a deeply negative correlation) up through +0.96 for wascx/mclox, which reflects virtually identical daily prices moves.
The somewhat surprising message is that some asset allocation funds deliver remarkably similar results through time while others exhibit radically disparate performances. The lesson, of course, is that selecting an investment strategy and/or fund requires quite a bit of effort to understand what’s driving risk and return.
It may be tempting to simply decide that the top performer is the superior fund. That could be true, but it could turn out to be wrong. Similarly, the bottom performer may in fact have some impressive attributes that aren’t obvious by looking solely at returns. As always, it’s crucial to filter all this through an investor’s risk tolerance, investment goals, etc.
In future posts I’ll focus on some of the econometric techniques for developing deeper perspective on evaluating returns through a risk-adjusted prism. This is essential work, of course, whether you’re looking at asset allocation funds or monitoring/evaluating other portfolios.
It’s also work that’s been known to deliver a surprise or two for the simple reason that some strategies aren’t always what they appear to be once you start digging into the details. True for funds/strategies focused on specific markets, true for asset allocation funds. All the more reason that it’s essential to analyze portfolios thoroughly with an econometric lens in search of the cold, hard facts.


Pingback: 02/27/15 - Friday PM Interest-ing Reads -Compound Interest Rocks
I was wondering whether you have an opinion about the combination of funds used in Meb Faber’s new etf,GAA.
Jack,
I know of it but haven’t studied it so I can’t really say much about the fund at this point. That said, I’m a fan of Meb’s thoughtful commentary and research on portfolio strategy. It’ll be interesting to see how his new fund performs.
–JP