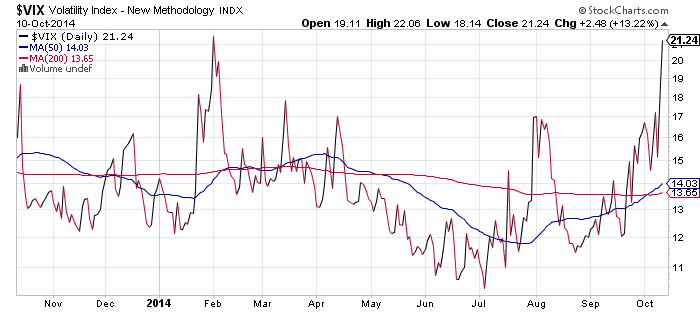
The crowd is getting anxious after the recent jump in stock market volatility, which typically accompanies falling prices. Last week the VIX Index—a widely followed measure of short-term expectations of market volatility—rose to 21.24 on Friday, the highest level since the spike in February to 21.44. The increase is “a dangerous sign because we’ll have broken through some resistance,” Donald Selkin, chief market strategist for National Securities Corp., tells Bloomberg.
If the VIX keeps rising, the trend will signal deeper trouble on the horizon for markets and perhaps the economy. But at the moment, the so-called fear index is still at modest levels relative to history and so it’s premature to assume the worst. Despite the latest increase, the current VIX reading of roughly 21 remains well below the 40-plus level in August/September 2011 and far below the nosebleed 80 reading that was briefly touched during the 2008 crash.
But this is no moment for complacency or looking away from the numbers for long stretches. Clearly, a persistent rise in the VIX from current levels would be a dark sign. But history reminds that not every jump in the VIX is fatal for the stock market’s broad trend. Context is crucial, which begins with the economic profile.
Data gets old quick these days, however. The key question at this point: Will the relatively upbeat US economic profile survive the ill winds blowing from Europe? So far, the macro trend for the US remains encouraging and two of this week’s main updates—industrial production (Oct. 16) and housing starts (Oct. 17)—are expected to show another round of improvement in the September releases, according to the consensus forecasts via Briefing.com. Retail sales (Oct. 15), however, look a bit vulnerable. In any case, we’re at a precarious moment, as the rising VIX reminds. The US stock market is on the defensive these days; as long as the macro picture holds up, it’s reasonable to assume that the bull market will survive. Battered and bruised, perhaps, but sufficiently intact to mount another leg up at some point. But if we see rising market volatility and a crumbling economic trend, well, that’s something else entirely.
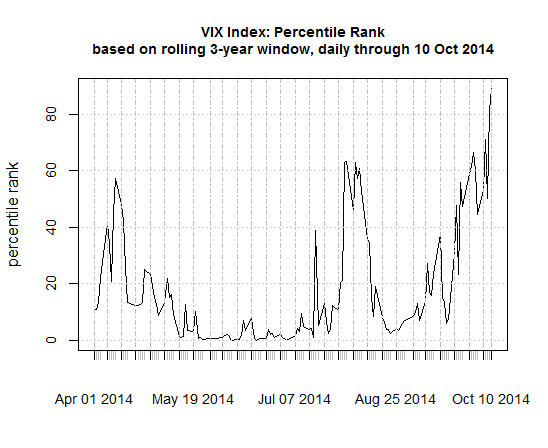
While we’re waiting for the economic numbers to arrive, let’s put the recent VIX surge into a deeper level of historical perspective by reviewing the index in terms of percentile rank based on a rolling three-year window. As the chart below shows, the current VIX level is at the 89th percentile rank relative to levels since 2011. When we consider a longer-term perspective, the comparison is less frothy. Based on a rolling 10-year window, the VIX is at the 69th percentile. That’s still the highest since February, but well short of the critical 90th percentile rank.
Other measures of market volatility tell similar stories. Standard deviation of daily returns for a rolling 30-day window for the S&P 500 is at the 73rd percentile as of Oct. 10. Meantime, the percentile rank for the 10-year window for standard deviation is at a softer 53.
Crunching the numbers with a Garch lens (via the rugarch package in R) provides a somewhat darker view. Here’s how the three- and 10-year-rolling windows for a Garch-based estimate of stock market volatility stack up at the moment in terms of percentile rank: 90.7 (3yr) and 74.4 (10yr).
The bottom line: risk is elevated and flashing a warning sign. It’s not yet clear that the warning sign rises beyond the level of predicting short-term turbulence. But this week could be decisive for deciding if the US is at a tipping point. The worst case-scenario: US equities continue falling and the economic news disappoints in a meaningful degree. In that case, it’s time to read the writing on the wall.
Is such a one-two punch likely? It’s easy at the moment to assume that negative momentum in stocks will roll on for a bit longer, but the macro trend still looks positive. But if the economic tide is turning, we may get a whiff of the change in this week’s macro updates.


Pingback: Monday links: competitive capitalism | Abnormal Returns