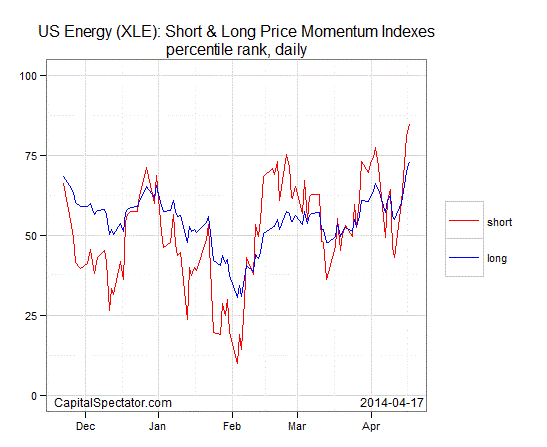
I’m always on the prowl for rebalancing opportunities–in particular, those moments when the odds look unusually high for success in one or more ETFs. Instances of screaming buys or sells are rare, of course, and when they do arrive the free low-cost lunch doesn’t last long. Accordingly, it’s essential to monitor the ebb and flow of markets on a regular basis so that you can grab a pearl before it turns back into a sow’s ear.
I usually start by comparing assets by way of price momentum. There’s a deep pool of academic and empirical research that tells us that this is a potent risk factor that explains a lot of what’s driving short-term performance. The challenge is figuring out how to define momentum–an essential component for systematically reviewing markets in search of the most-compelling rebalancing opportunities. There are many possibilities, but I prefer to stack up current prices against the median of several exponential moving averages and then transform the data into percentile ranks (for the details, see this post). The goal is developing a quick reference point for deciding how recent price action compares with history. As an example, let’s consider some ETFs that represent the major asset classes and US equity sectors.
Foreign REITs/real estate currently rank highest for short-term momentum for our usual list of ETF proxies for the major asset classes. The Vanguard Global ex-US Real Estate ETF (VNQI) is at the 76th percentile. This isn’t yet at the outer edges, but it’s close and so this ETF warrants attention in the days ahead as a possible candidate for selling.
Switching over to sector ETFs suggests that energy is running a bit hot if not overheating. The SPDR Energy Select Sector SPDR (XLE) tops the list in this corner for short-term momentum, reaching the 85th percentile rank as of last week’s close.
Can you count on momentum as a flawless signal for calling tops and bottoms? No, of course not. But as one aspect of a broadly defined risk-management process, the momentum factor is a powerful tool. The strongest signals arise when price momentum is extreme. That’s a high standard, and none of the ETFs noted above are in that category. But some are getting close. Be careful, however, as you could miss it if you blink. The state of excess in matters of price momentum is a fleeting event, although it typically offers the most attractive odds for success for exploiting mean reversion. The ripest fruit of expected risk premia never hangs on the vine for very long, but when you grab it at the right moment–if you can–it’s the closest thing to bliss in Mr. Market’s orchard.


Pingback: Ranking ETF’s on Momentum – The Capital Spectator | Marty Investor
I think we have a lot in common in our thrust for knowledge as it relates to developing academic work in the areas of momentum / volatility /risk parity . My question pertains to any data that you have come across as it relates to short momo signals vs long momo signals or most importantly dual short long signals. As you are aware there is tremendous work as it relates to volatility and the periods of low vol that are more advantageous to put on more exposure .
Thank you