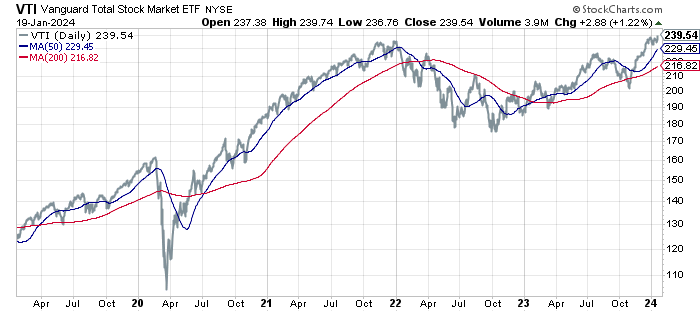
Wall Street celebrated on Friday when the S&P 500 Index, the most popular benchmark of US shares, closed at a record high for the first time in more than two years. The celebration, however, was an outlier as the rest of the major asset classes continue to trade below previous peaks in varying degrees, based on a set of ETFs through the close of trading on Jan. 19.
Here are some of the highlights (and lowlights) of current peak-to-trough declines. Let’s start with American shares, based on Vanguard Total US Stock Market ETF (VTI), which also ended the week at a record.

The party ends with US stocks, at least for the moment. As the next chart reminds, drawdowns still prevail for the rest of markets, ranging from the slight to the deep.

US junk bonds are a close runner-up to US stocks in the peak-to-trough competition. SPDR Bloomberg High Yield Bond ETF (JNK) ended Friday’s trading at roughly 2% below its previous peak. By contrast, there are several double-digit drawdowns currently on the ledger. Leading in the red-ink games: government bonds in developed-markets ex-US (VEA BWX) with a steep 26% drawdown.
For context, the Global Market Index (GMI) ended last week with a relatively mild 3.2% drawdown. GMI is an unmanaged benchmark (maintained by CapitalSpectator.com) that holds all the major asset classes (except cash) in market-value weights via ETFs and represents a competitive benchmark for multi-asset-class portfolios.
What’s the source of the US stock market’s recent gains? “Clearly, the consensus is that inflation is under control and we’re heading for a soft landing,” says Doug Fincher, a portfolio manager at hedge fund Ionic Capital Management. “It’s certainly possible—but a lot of that is priced in.”
Ed Yardeni at Yardeni Research sees three “possible historical precedents for the economy, the Fed, and the stock market’s performance ahead.” The most likely (60%), in his estimation, is a “Roaring 2020s” scenario. “Our basic premise is that a chronic shortage of labor is forcing companies to use technological innovations to boost their productivity growth, which started to improve last year according to the government’s quarterly data. As a result, inflation remains subdued, while real GDP growth, real wage growth, and profit margins all get boosted. The Fed is likely to ease, but won’t have to cut the federal funds rate by much. Stock investors do very well.”
For the moment, the crowd seems inclined to agree. The rest of the world’s markets, by contrast, are in varying stages of second-guessing (denial?) of what comes next.
Learn To Use R For Portfolio Analysis
Quantitative Investment Portfolio Analytics In R:
An Introduction To R For Modeling Portfolio Risk and Return
By James Picerno
Minor typo: “Leading in the red-ink games: government bonds in developed-markets ex-US (VEA) with a steep 26% drawdown.” This should refer to BWX not VEA.
Correct. Thanks DanM. Apologies to readers.
–JP