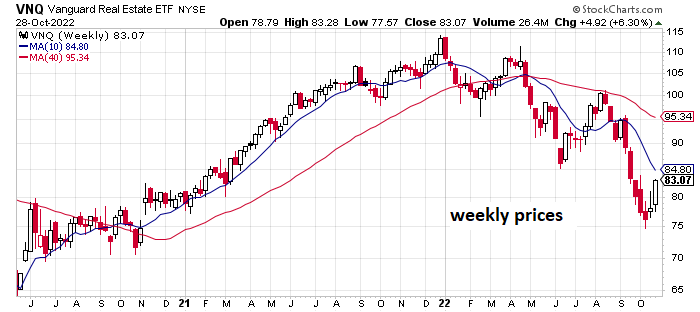
For a second week in a row, the major asset classes rallied, with a notable exception: stocks in emerging markets. Otherwise, risk assets continued to recover in the trading week through Friday, Oct. 28, based on a set of ETFs.
US real estate investment trusts posted led the gainers last week via Vanguard Real Estate Index Fund (VNQ). The ETF surged 6.3%, building on the previous week’s rally.

Despite VNQ’s strong results over the past two weeks, the price trend remains decidedly bearish. One factor that’s creating headwinds for REITs, which are prized for relatively high payout rates: stronger competition from governm ent bonds in the wake of recent rate hikes by the Federal Reserve, which is expected to lift rates again at this week’s policy meeting (Nov. 2). The 10-year Treasury yield, for example, is currently 4.02% (as of Oct. 28), which is modestly above the 3.89% trailing 12-month yield for VNQ, according to Mornignstar.com.
The only slice of the major asset classes to lose ground last week: equities in emerging markets via Vanguard Emerging Markets Stock Index Fund (VWO), which fell 3.2%, closing near its lowest level in 2-1/2 years.
Last week’s broad-based rally lifted the Global Market Index (GMI.F), an unmanaged benchmark, maintained by CapitalSpectator.com. This index holds all the major asset classes (except cash) in market-value weights via ETFs and represents a competitive measure for multi-asset-class portfolio strategies overall. GMI.F posted another strong gain last week, rising 3.3% (red line in chart below).

Turning to the one-year trend, not much changed after last week’s trading. Commodities (GCC) remain the only gainer for the major asset classes. GCC is up a modest 3.4% over the past year, the lone winner vs. the rest of the field.
GMI.F is down 18.8% for the past year.

Comparing the major asset classes through a drawdown lens continues to show steep declines from previous peaks across the board. The softest drawdown at the moment: US junk bonds (JNK) with a 12.5% drawdown. Meanwhile, emerging markets stocks (VWO) reflect the deepest peak-to-trough decline with a roughly 34% slide.
GMI.F’s drawdown: -20.1% (green line in chart below).

Learn To Use R For Portfolio Analysis
Quantitative Investment Portfolio Analytics In R:
An Introduction To R For Modeling Portfolio Risk and Return
By James Picerno