There are no shortage of risks weighing on markets and economies these days, but perhaps the first question that’s on every investor’s mind: When will the Fed pivot? Everyone has a view, but no one has a clue, which is why monitoring the ebb and flow of key indicators is the first stop on the road to guesstimating when the tide will turn. As the data below suggests, however, a pause in Federal Reserve rate hikes – much less a rate cut – still looks like a low probability event for the immediate future.
The first clue for managing expectations: Fed funds futures, which are pricing in high odds of more rates hikes for each of the next two FOMC meetings. First up is the upcoming Nov. 2 policy announcement, which has a virtual certainty of dispensing another 75-basis-points rate hike, according to the crowd.
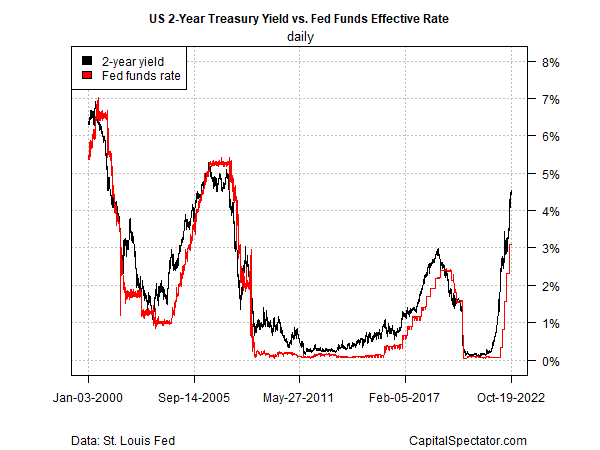
Turning to the bond market, the policy-sensitive 2-year US Treasury yield is telling a similar story as this key rate continues to trend higher. The crowd lifted the yield to 4.62% yesterday (Oct. 20), the highest since 2007. As long as this key rate trends up, it signals hawkish expectations for Fed policy. For the moment, pivot risk is effectively nil on this front.

Another way to monitor the implied outlook for Fed policy via the 2-year yield and using it as a predictor of the effective Fed funds target rate. History gives this spread high marks for looking ahead. On that basis, the 2-year yield remains well above the Fed funds rate, which is a forecast that the central bank is still playing catch-up and will continue to raise rates.

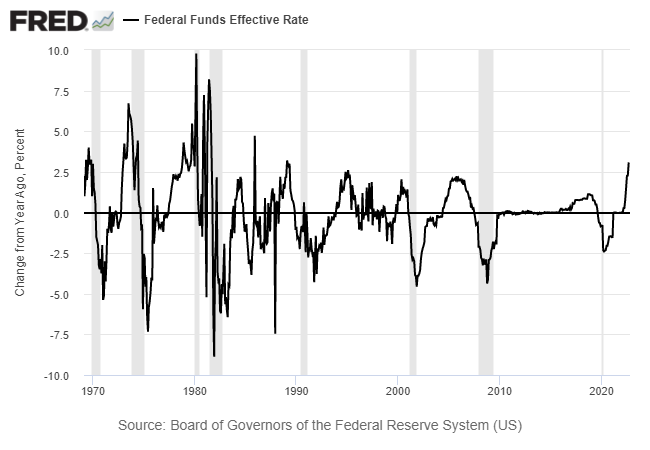
For another perspective on the Fed funds rate trend, the next chart shows how it’s changed on a rolling one-year basis. The key takeaway: the current rise – 3 percentage points above the year-ago level (as of Oct. 19) – is the steepest jump since the 1980s. This history suggests that the sharp rise is at or near the point that raises recession risk, which in turn implies that the rate-hiking cycle is close to ending. History suggests that the Fed funds rate will start falling on a rolling one-year basis well ahead of a new recession. But this time could be different and so the key question for the weeks and months ahead: Has the Fed gone too far with its current rate hikes? One reason to think it has: recent signs that a recession is starting via housing data and a broader measure of the US business cycle. Ditto for yesterday’s update of the US Leading Economic Index for September.

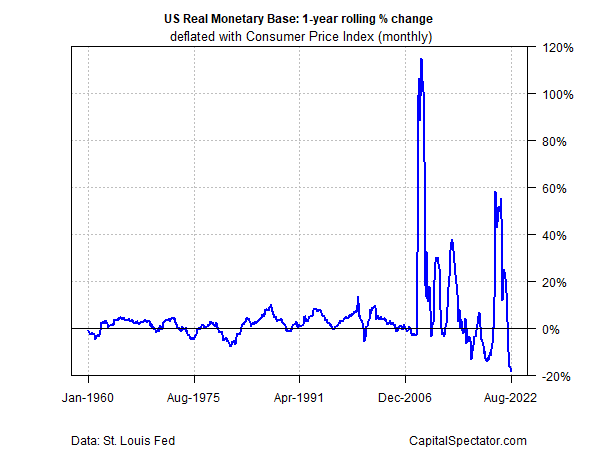
Another indicator that will probably drop an early clue that a pivot is near: the rolling one-year change in the inflation-adjusted base money (M0) supply, a key factor for measuring the directional bias for money supply changes. The latest data, however, continue to skews sharply hawkish. A hint that the odds of turning in favor of a pivot will arrive when this one-year trend stops falling. To date through August, however, that turning point has yet to arrive, based on 12 straight months of decline.

Although the numbers betray no signs of a imminent pivot, the potential for a sudden change may be near. The critical factor: incoming economic data. When economic deterioration becomes sufficiently robust, the Fed may decide to pause… or would it?
Would the Fed pause (and then cut) if economic pain deepens but with only mild evidence that inflation is cooling? Unclear. The Fed’s credibility is on the line to a degree that hasn’t been true for decades. As such, the central bank can’t afford to fail in convincing markets that it has the determination to tame inflation, whatever it takes. The stakes, at least in theory, are unusually high this time. That doesn’t ensure that the Fed will keep hiking until inflation breaks, but betting against that policy path still carries long odds.
How is recession risk evolving? Monitor the outlook with a subscription to:
The US Business Cycle Risk Report