No one knows, of course, but history can offer some perspective for what’s possible and so it’s useful to compare the current regime shift with previous runs of tighter policy.
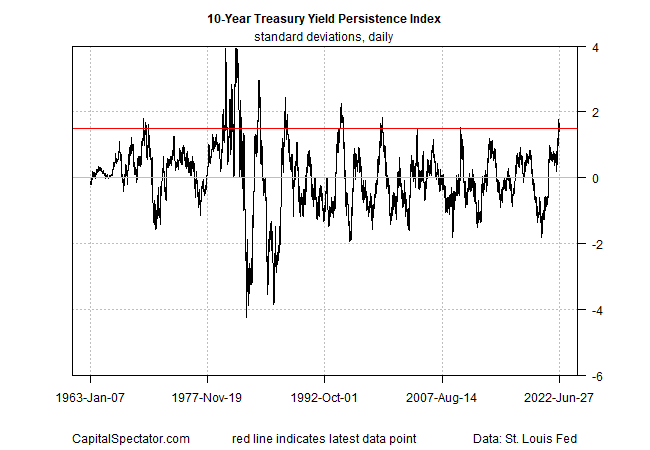
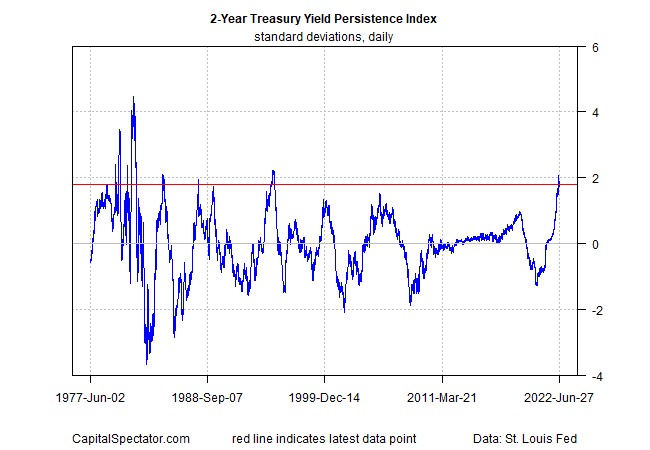
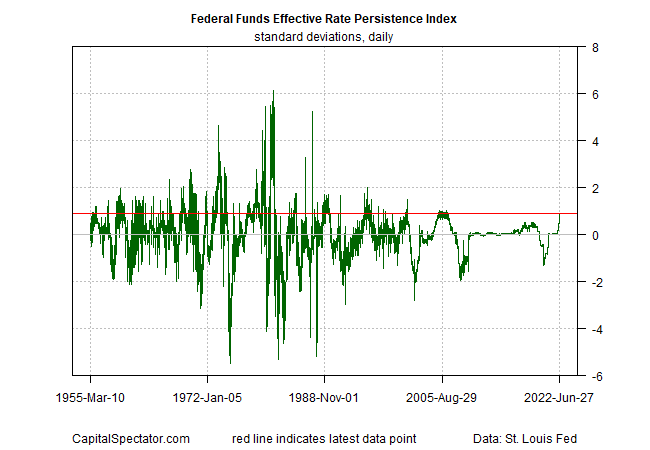
To filter the changes in interest rates and emphasize the signal over noise I’m looking at the one-day differences in one-year changes and then transforming the data into Z-scores. For reference, I call this data a persistence index. Let’s review three key rates through this lens: the 10-year Treasury yield, the 2-year yield (a proxy for rate expectations), and the Fed funds target rate.
In the first chart, it’s clear that the 10-year rate’s recent pop is among the biggest upward shifts in years. That said, the degree of increase is not unprecedented. Given that inflation is still substantially higher than the 10-year rate it’s hardly a stretch to assume that the Treasury maturity can run higher still.

A similar profile applies to the 2-year yield, which has increased by a degree not seen in several decades.

For the Fed funds rate, the current rise to date is comparable to the rate hikes that preceded the financial crisis in 2008. But if the inflation surge is as problematic as some hawks say it is, history suggests that the Fed funds rate could rise much higher, as it did in the 1970s and 1980s.

For the immediate future, the outlook for another 75-basis-points rate hike appears set in stone for the July 27 Federal Open Market Committee (FOMC) meeting, based on Fed funds futures.
Cleveland Fed President Loretta Mester –a voting member of the FOMC – is on board with that outlook. “If conditions were exactly the way they were today going into that meeting — if the meeting were today — I would be advocating for 75 because I haven’t seen the kind of numbers on the inflation side that I need to see in order to think that we can go back to a 50 increase,” she explains.
How is recession risk evolving? Monitor the outlook with a subscription to:
The US Business Cycle Risk Report