The 10-year US Treasury yield has been moving higher in recent weeks. Does the shift signal an extended run higher? There’s a firmer upside bias lately, although this change doesn’t yet look decisive, although our average fair-value estimate of the 10-year rate continues to indicate that the path of least resistance is up.
Let’s start with a simple profile of recent trending behavior. A set of moving averages now point to an upside bias for the first time since the spring. The recent change could be noise, of course. Much depends on how the trending signals evolve in the weeks ahead. But for the moment, it appears that downside bias that prevailed through the summer has faded.

One reason for reserving judgment: the 10-year rate has traded in a tight range since our previous update a month ago. Although elevated inflation endures, along with encouraging signs for a rebound in economic growth in the fourth quarter, this macro information has yet to lift the 10-year rate decisively above the recent highs. That’s a clue for wondering if a prolonged trading range is the likely outlook for the near term.
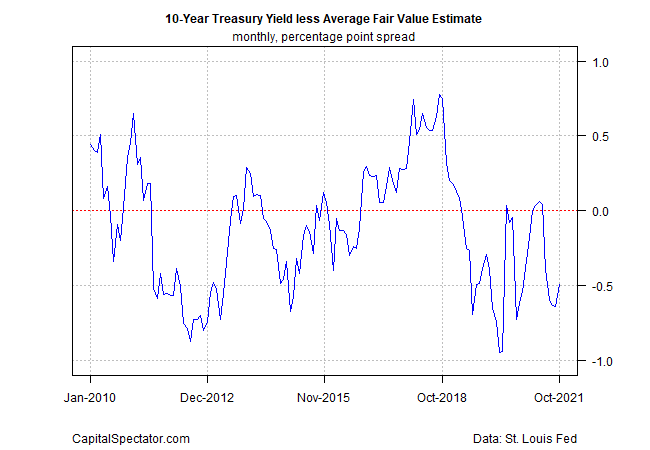
Meanwhile, CapitalSpectator.com’s fair value estimate of the 10-year rate continues to signal a case for a higher yield. The median estimate for October is 2.07%, comfortably above last month’s 1.58% market rate (based on the average for October). The 49-basis-point spread in favor of the mean estimate suggests that the market is modestly underpricing the 10-year rate and so, in theory, there’s pressure for repricing closer to 2%-plus.

Another way to look at the spread is to see it as a factor that will ease downside bias for the market rate. By contrast, when the mean estimate is below the current market rate, that’s a factor suggesting the 10-year rate will fall or have a tougher time rising. The last time that the fair value estimate was below the 10-year market rate was in March-May 2021. Not surprisingly (or so one could argue), the 10-year rate fell from that point forward through late-summer — a trend that, for now, appears to have run its course.
For clearer perspective on the spread, the chart below shows how it’s evolved since 2010. Since June, the spread has been negative, meaning that the fair-value estimate is above the market rate. Although the negative spread eased in October (turning up to -49 basis points from September’s -0.64), it’s still below zero. That’s a factor suggesting that the current market rate will be flat to higher in the near term.

How is recession risk evolving? Monitor the outlook with a subscription to:
The US Business Cycle Risk Report