Would you know an oversold or overbought market if you saw one? Wall Street is obsessed with the question. And so is every trader, and perhaps more than a few investors who otherwise think they have a long-term horizon.
Devising metrics to answer these questions (or at least provide some perspective) is a productive effort, at least in theory. In practice, however, it’s fraught with an excess of confusion and dead ends. The main challenge is that finance isn’t physics. Even if you can accurately identify periods when the market has moved to excess, that’s no guarantee that equilibrium is near.
That doesn’t mean we shouldn’t routinely monitor signs of excess. But in these efforts it’s important to manage expectations, starting with the elephant in the room: no measure of market excess is flawless and many are prone to noise.
Where to begin? Answering is tougher than it sounds because there are hundreds (thousands?) of metrics in this corner. Perhaps a reasonable first approximation is looking at what can be labeled as cyclical indicators. Here, too, there are many possibilities, ranging from technical indicators (relative strength indices, for instance) to measures of how current prices stack up against an average.
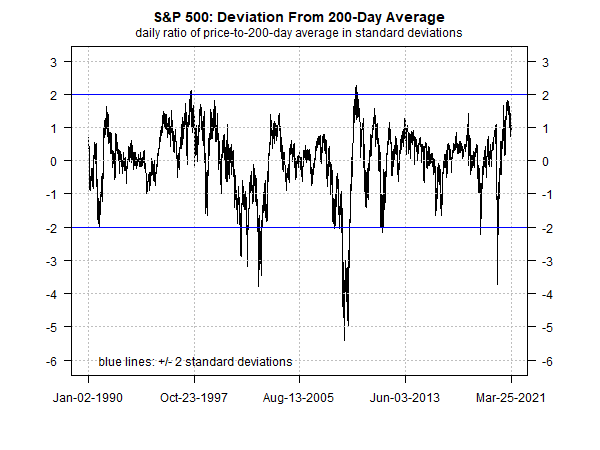
The latter category is a sensible starting point. For example, consider how the S&P 500 compares vs. its 200-day moving average. To provide some historical perspective, let’s compute the ratio of current price to average price and then translate those values into standard deviations. Two standard deviations (plus or minus) is a proxy for a statistically significant move because such changes represent about 95% of variation for a given data set.
On that score, recent market action looks relatively extreme.

Betting the farm on any one metric, however, may be asking for trouble. To minimize the risk of false signals we can look to other metrics. For instance, the next chart below shows the S&P 500’s rolling one-year returns in standard deviations. On this basis, the recent rally looks far more excessive vs. the chart above, although the recent moon shot reflects comparisons with the drama of the coronavirus crash a year ago and so the latest surge may be misleading.

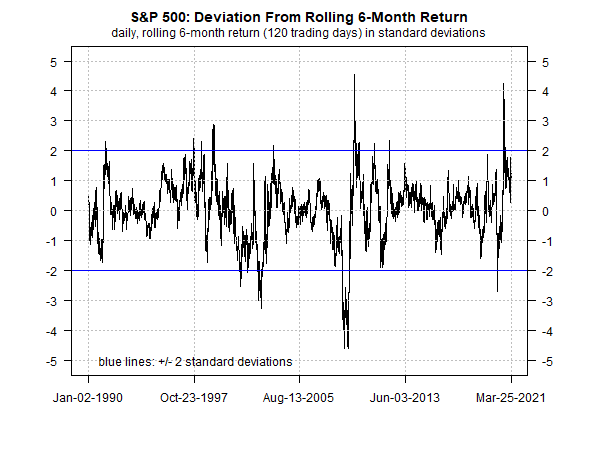
Running the same analysis on rolling 6-month return paints a less-extreme profile.

As the charts above remind, there’s a risk of finding noise by looking at too few or too many metrics. Ditto for selecting the wrong metrics – “wrong” in the sense that the analysis doesn’t match your risk tolerance, investment horizon, and other factors specific to the strategy you’re running.
In short, customizing the analysis to determine if the market is oversold or overbought is no simple matter. Even if you develop a “perfect” system, there’s another problem – just because Mr. Market has gone off the deep end doesn’t mean you can easily profit from this condition. As the old saw reminds, the market can stay irrational for longer than you can stay solvent. Nonetheless, looking at a range of carefully selected metrics is useful, if only for assessing the probability of what comes next.
Learn To Use R For Portfolio Analysis
Quantitative Investment Portfolio Analytics In R:
An Introduction To R For Modeling Portfolio Risk and Return
By James Picerno
Pingback: What Is an Oversold or Overbought Market? - TradingGods.net