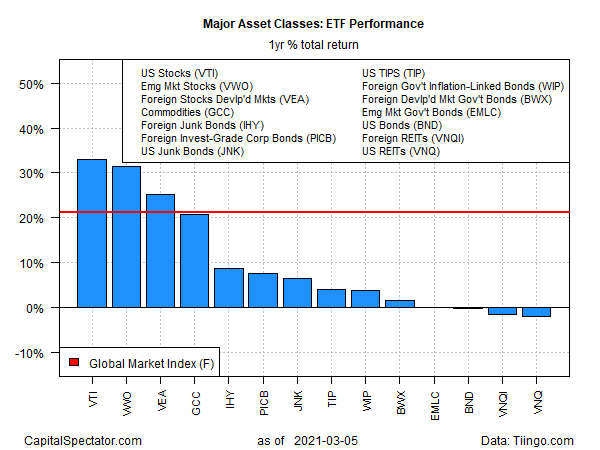
In a mixed week for asset classes, shares in developed nations ex-US ran away with the best performance for trading through Friday, Mar. 5, based on a set of proxy ETFs representing the major asset classes.
Vanguard FTSE Developed Markets (VEA) rose 1.1% last week, easily outpacing the rest of the field. The fund’s gain marks its first weekly advance in three weeks, as shown in the chart below.

Last week The Wall Street Journal reported that “international exchange-traded funds are back in favor.” Andrew Mies, chief investment officer at 6 Meridian, says “the domestic equity run was so extraordinary that investors ended up being underweight in both developed and emerging markets. The recent flows show a move to rebalance.”
Broadly defined commodities were the second-best asset class performer last week: WisdomTree Continuous Commodity Index Fund (GCC) rose 0.6%.
Most categories of bonds lost ground last week, with emerging markets governments taking the biggest hit. VanEck Vectors JP Morgan EM Local Currency Bond (EMLC) fell 1.5% — the fund’s third straight weekly loss.
The Global Markets Index (GMI.F) rebounded last week, posting a fractional gain – the first advance in three weeks. This unmanaged benchmark, which holds all the major asset classes (except cash) in market-value weights via ETF proxies, edged up 0.1% for the trading week.

For the trailing one-year return, US equities are holding on to a slight lead over emerging-markets stocks, the second-strongest performer for this period.
Vanguard Total US Stock Market (VTI) is up 33.1% over the past 12 months on a total return basis. That’s ahead of the 31.5% one-year return for Vanguard FTSE Emerging Markets (VWO).
US real estate investment trusts (REITs) continue to post the deepest one-year loss for the major asset classes via Vanguard Real Estate (VNQ), which is down 2.0%.
GMI.F’s one-year return is a strong 21.2% increase.

US and foreign junk bonds are currently posting the smallest drawdowns for the major asset classes. VanEck Vectors International High Yield Bond (IHY) closed on Friday at 0.9% below its previous peak. A close second for smallest drawdown: SPDR Bloomberg Barclays High Yield Bond (JNK), which has a peak-to-trough decline that’s virtually identical to IHY’s.
By contrast, broadly defined commodities continue to suffer the deepest drawdown for the major asset classes: roughly -35%.
GMI.F’s current drawdown is a relatively mild 2.9%.

Learn To Use R For Portfolio Analysis
Quantitative Investment Portfolio Analytics In R:
An Introduction To R For Modeling Portfolio Risk and Return
By James Picerno