There’s an old Wall Street proverb that warns that the market can remain irrational for longer than you can stay solvent. The wisdom, or at least the empirical reality of that idea, has been put to the test in recent years on at least three fronts in the equity market via the persistent outperformance of growth stocks over value, large caps over small caps and US over foreign.
Adam Berger at Wellington Management recently penned a thoughtful research note on this trio, reminding investors that “the outperformance [of the three trends] has been so extreme over the past 10 years that… it has effectively wiped out the longer-term (30 – 40 year) trends many of us have come to expect: value, small-cap, and non-US equities leading the way.”
As a recap, let’s review these “three performance anomalies,” as Berger labels them, in recent history through a prism of ETF proxies, as of yesterday’s close (Aug. 13). To map the trends we’ll look at the performance spread for the relevant fund pairs, starting with the growth-value ratio via US large-cap stocks.
Learn To Use R For Portfolio Analysis
Quantitative Investment Portfolio Analytics In R:
An Introduction To R For Modeling Portfolio Risk and Return
By James Picerno
In the first chart, the line represents the spread for the iShares Russell 1000 Growth (IWF)/iShares Russell 1000 Value (IWD) for the past five years. The upside trend, which indicates growth outperforming, is obvious. What’s surprising is the acceleration in the trend in 2020. It seems that the coronavirus crisis has fueled growth’s long-running edge over value into overdrive.

A similar pattern can be found in the US large-cap/small-cap spread, based on iShares Russell 1000 (IWB)/iShares Russell 2000 (IWM). The rising line indicates that large caps continue to beat small caps.

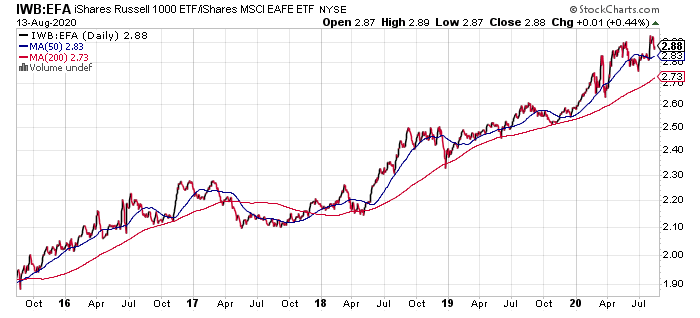
For the third anomaly, the US premium over foreign shares (for developed markets) is less volatile but no less persistent in recent history. In the third chart below, a surprisingly steadfast outperformance in US shares over their EAFE counterparts has been tenacious for the past five years, based on iShares Russell 1000 (IWB)/iShares MSCI EAFE (EFA).

These spreads raise a number of questions about how to interpret the trends for portfolio strategy? There are many possibilities but no silver-bullet solutions that will appease all investors. As usual, much depends on risk tolerance, investment horizon and other factors.
Perhaps the closest thing to generic insight via the charts above: refocus on your rebalancing strategy. Combine that with a deep pool of research that suggests that the anomalies above won’t last forever. That could turn out to be incorrect, of course – this is finance and not physics, after all.
Nonetheless, it’s reasonable not to bet the farm on assuming that all three trends are forever dead. If I had to guess, I’d say there’s a pretty decent probability that at least one of these trends will reverse at some point within the next one to three years. In fact, it’s not unreasonable to wonder if mean reversion will eventually apply to all three.
A reasonable way to hedge your bets is to maintain a broadly diversified portfolio in the equities space. Your degree of confidence (or lack thereof) on the trends above should influence weights. For example, if you think that small cap stocks are likely to regain their former advantage in minting risk premia, your portfolio would reflect a higher-than-market weight in these stocks. Alternatively, if you’re skeptical that small caps are again destined for performance glory, a case for a below-market-weight allocation is in order.
By contrast, extreme allocations — e.g., avoiding small caps — look overly risky for most investors. The future is always uncertain (and always full of surprises) and so it’s usually prudent to maintain some level of contrarian-based risk positioning.
Adding a systematic rebalancing strategy to manage weights can help. On that basis, many investors are likely to have relatively low (zero?) allocations to the laggards noted above. If so, that’s a clue that rebalancing away from the winners, if only on the margins, is probably a timely decision.
How is recession risk evolving? Monitor the outlook with a subscription to:
The US Business Cycle Risk Report
Pingback: Testing Market Strategies - TradingGods.net
Pingback: Conventional Wisdom - Mark Schwarzmann
Pingback: Conventional Wisdom? | Independence Associates, LLC