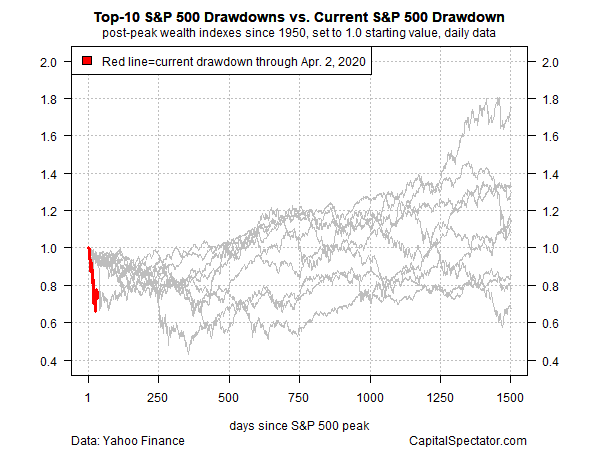
In a previous post, I simulated S&P 500 drawdowns for perspective on what the current market correction may dispense in the weeks and months ahead. Let’s supplement that analysis by visually comparing the current and ongoing peak-to-market decline with the ten deepest drawdowns since 1950.
History doesn’t repeat, at least not exactly when it comes to stock market trends. But you can still learn a lot by studying the past, which is an imperfect but nonetheless useful guide for framing the future.
Learn To Use R For Portfolio Analysis
Quantitative Investment Portfolio Analytics In R:
An Introduction To R For Modeling Portfolio Risk and Return
By James Picerno
Here’s how the ten-biggest drawdowns stack up against the current decline, which is highlighted in the table below. As of last night’s close (Apr. 2), the S&P 500 has tumbled 33.9% from its previous peak in February. The current reversal of fortune to date ranks as the fifth-biggest slide since 1950, which implies that the decline could get deeper still. All the more so when you consider the economic blowback that’s roll out in the US and around the world due to coronavirus fallout.

It helps to summarize the data above by visually comparing the current drawdown against its ten-deepest predecessors. One aspect that jumps out in the chart below: the current slide (red line) has been unusually sharp and swift vs. history.

It’s also clear that the current drawdown could roll on for some time, or so previous declines suggest. Indeed, there’s no law that says a decline that’s deep and quick must end in kind. Although in some cases recoveries arrived in short order (a mere 86 days in the 1990-91 correction to regain the old high), much longer clawbacks are typical. The longest since 1950: the 1973-1974 bear market—the S&P 500 only regained its old high in 1980—nearly 1,500 trading days following the previous peak.
The future, of course, remains uncertain as ever–perhaps more so than usual these days. What is clear is that market history, combined with the headlines du jour, provide a strong case for managing expectations down until further notice.
How is recession risk evolving? Monitor the outlook with a subscription to:
The US Business Cycle Risk Report
Pingback: Time to Manage Expectations Down - TradingGods.net
Pingback: Quantocracy's Daily Wrap for 04/03/2020 | Quantocracy