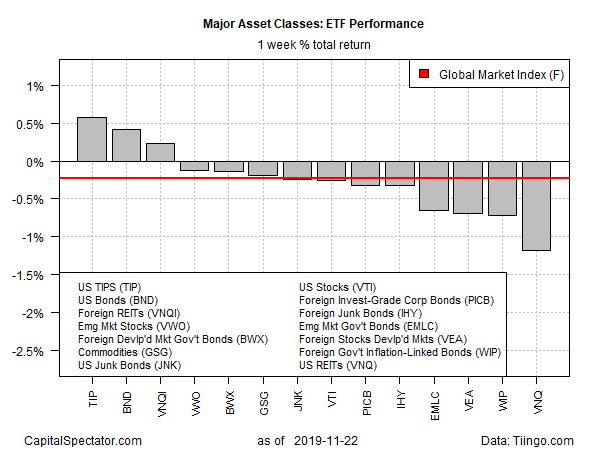
Most of the major asset classes lost ground last week, according to a set of exchange-traded funds. Bucking the downside trend: US investment grade bonds and foreign real estate shares. Otherwise, red ink prevailed in global markets over the five days of trading through November 22.
Last week’s top performer: iShares TIPS Bond (TIP). The fund, which targets inflation-indexed Treasuries, rose 0.6%, lifting the ETF close to its highest level since early October. So far in 2019, TIP is up 8.1%.
Also in the winner’s circle last week: a broad measure of investment-grade US bonds (Vanguard Total Bond Market Index Fund ETF Shares (BND)) and a portfolio of foreign real estate shares (Vanguard Real Estate (VNQI)).
Losses dominated the rest of the major asset classes, led by US REITs via Vanguard Real Estate (VNQ), which eased 1.2% last week. For the year to date, however, VNQ continues to post a strong 25.8% gain after factoring in distributions.
Learn To Use R For Portfolio Analysis
Quantitative Investment Portfolio Analytics In R:
An Introduction To R For Modeling Portfolio Risk and Return
By James Picerno
Widespread selling in markets last week, however, weighed on an ETF-based version of the Global Market Index (GMI.F) — an unmanaged benchmark that holds all the major asset classes (except cash) in market-value weights. GMI.F shed 0.2% – the first weekly setback for the index in nearly two months.

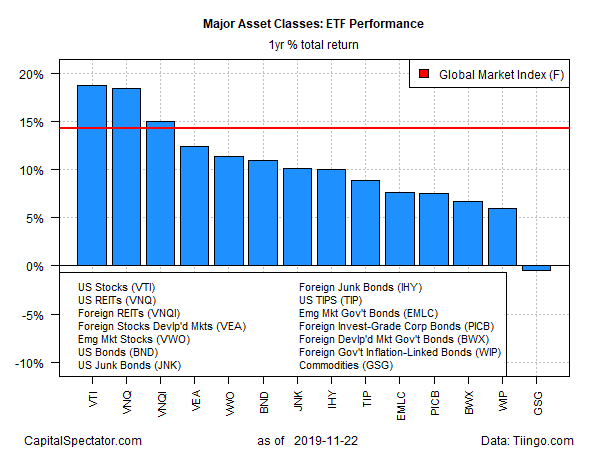
For the one-year trend, US stocks and US REITs are in a virtual dead-heat for the top performance among the major asset classes. Ahead by a hair: Vanguard Total US Stock Market (VTI), which is up 18.7% for the trailing 12-month window. VNQ is a close second-place performer over the past year, posting an 18.5% total return.
A broad-based portfolio of commodities continues to suffer the only loss for the major asset classes for one-year results (252 trading days). But note that a rally in recent weeks has pared the formerly deep one-year decline to a fractional 0.5% slide for iShares S&P GSCI Commodity-Indexed Trust (GSG) at Friday’s close vs. the year-ago level.
GMI.F continues to post a strong gain for the one-year window: 14.2% in total-return terms.

Profiling all the ETFs listed above through a momentum lens continues to show an upside bias overall. The analysis is based on two sets of moving averages. The first compares the 10-day moving average with its 100-day counterpart — a proxy for short-term trending behavior (red line in chart below). A second set of moving averages (50 and 200 days) represent the intermediate measure of the trend (blue line). At last week’s close, most markets remain in a bullish posture.

Is Recession Risk Rising? Monitor the outlook with a subscription to:
The US Business Cycle Risk Report