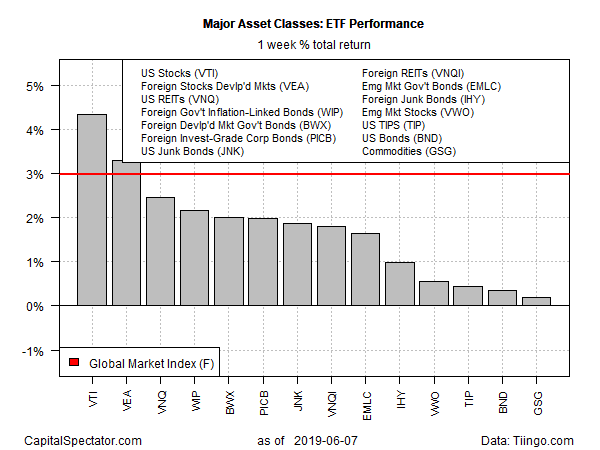
Global markets rebounded last week, posting gains in all corners of the major asset classes, based on a set of exchange-traded funds. The broad sweep of positive returns marks the first across-the-board price increases on a calendar-week basis in three months.
Leading the way higher: US equities. Vanguard Total Stock Market (VTI) surged 4.3% for the trading week through June 7. The gain marks the ETF’s first weekly advance in five weeks and its best weekly increase since November.
Last week’s revival in animal spirits for US stocks was initially bound up with fears that the President Trump was poised to impose new tariffs on Mexico, which would weaken economic growth and thereby force the Federal Reserve to cut interest rates. The market seemed to focus on the rising odds of a rate hike as a positive for the economy, which helped boost equity prices. But then Trump announced on Friday, after the US markets closed, that the US had dropped plans for tariffs. Will that kill the rally? No, or so early trading on Monday suggests: the risk-on sentiment appears set to carry over into today’s trading, based on higher S&P 500 futures ahead of the New York opening.
Is Recession Risk Rising? Monitor the outlook with a subscription to:
The US Business Cycle Risk Report
“The news of the deal with Mexico is likely to power global equities higher,” predicted Ben Emons, managing director for global macro strategy at Medley Global Advisors. “Averting tariffs on Mexican goods is a relief for the US economy because it reduces uncertainty. It is positive for auto companies and other corporations that are highly leveraged to the Mexican border supply chain.”
It seems that the stock market is keen on rising with or without tariffs. Illogical? Perhaps, but for the moment the bulls are happy.
Last week’s revival in market prices lifted an ETF-based version of the Global Market Index (GMI.F), an unmanaged benchmark that holds all the major asset classes (except cash) in market-value weights. The index rose 3.0%–the first weekly increase in five weeks.

Turning to the one-year trend, US real estate investment trusts (REITs) continue to hold the top spot by a wide margin. Vanguard Real Estate (VNQ) is up a hefty 16.2% on a total-return basis over the trailing 252-trading-day period.
The second-best one-year performer for the major asset classes: investment-grade US bonds. Vanguard Total Bond Market (BND) is up 7.6% after factoring in distributions—a solid gain, but well behind VNQ’s one-year rally.
Meantime, the biggest one-year loss at the moment: broadly defined commodities. The iShares S&P GSCI Commodity-Indexed Trust (GSG) has shed 13.5% over the past year through Friday’s close.
GMI.F’s one-year total return at the end of last week’s trading is a subdued 2.1% gain.

Although last week’s broad-based rebound gave all the markets a lift, the momentum profile still looks challenged, based on two sets of moving average. The first momentum measure compares the 10-day moving average with the 100-day average, a proxy for short-term trending behavior (red line in chart below). A second set of moving averages (50 and 200 days) offers an intermediate measure of the trend (blue line). The indexes range from 0 (all funds trending down) to 1.0 (all funds trending up). Based on data through last week’s close, it appears that upside momentum has peaked (suggested by the recent slide in the short-term index from its recent high). The question is whether last week’s rally is the first installment on a revival in the 2019 rally that’s faced headwinds lately? Perhaps this week’s trading action will provide the answer, or at least a telling clue.

Learn To Use R For Portfolio Analysis
Quantitative Investment Portfolio Analytics In R:
An Introduction To R For Modeling Portfolio Risk and Return
By James Picerno