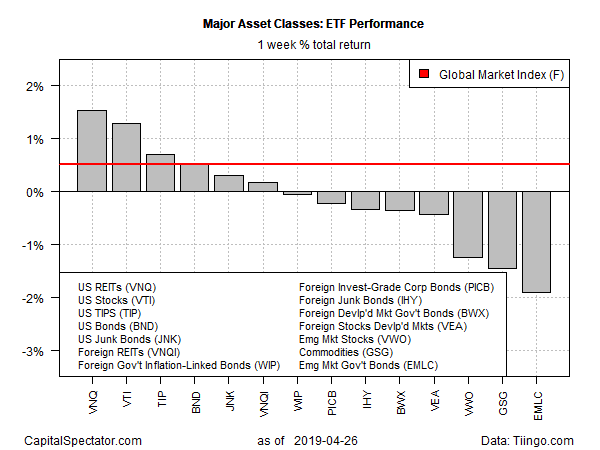
The major asset classes that track global markets posted mixed results last week, but there was no ambiguity for US assets, which enjoyed across-the-board rallies, based on a set of exchange-traded funds.
US-listed real estate investment trusts (REITs) led the way for the trading week ended Friday, April 26 via Vanguard Real Estate (VNQ), which gained 1.5%. The ETF’s rally clawed back a large chunk of the previous week’s hefty loss.
US assets overall rallied last week. Indeed, the top-five performers were ETFs targeting various slices of US markets.
Last week’s biggest loser: bonds issued by governments in emerging markets. VanEck Vectors JP Morgan Emerging Markets Local Currency Bond (EMLC) fell 1.9%. Last week’s setback leaves the ETF close to its lowest close since late-March.
A factor in the headwind for emerging markets bonds of late: weakness in the underlying currencies. “EM FX had an awful week, with virtually every currency down against the dollar,” writes Win Thin, global head of emerging markets at Brown Brothers Harriman.
The Global Markets Index (GMI.F) posted a modest gain last week. This investable, unmanaged benchmark that holds all the major asset classes (except cash) in market-value weights rose 0.5%.
For the one-year trend, US REITs continue to lead the major asset classes. Vanguard Real Estate (VNQ) is up a strong 22.1% on a total-return basis for the past year (252 trading days). The performance is well ahead of the second-best one-year return via US equities — Vanguard Total Stock Market (VTI) is up 12.7% for the trailing one-year window.
Emerging markets bonds are suffering from the weakest one-year performance. EMLC has lost 6.3% over the trailing 12 months through Friday’s close.
GMI.F’s one-year return is a moderate 5.4% gain.
Meantime, a technique for profiling momentum for all the major asset classes (based on the ETFs above) continues to show a broad-based upside bias, based on two sets of moving averages. The first definition compares the 10-day moving with the 100-day average, a measure of short-term trending behavior (red line in chart below). A second set of moving averages (50 and 200 days) offers an intermediate measure of the trend (blue line). The indexes range from 0 (all funds trending down) to 1.0 (all funds trending up). Based on data through last week’s close, bullish momentum remains widespread for the 14 ETFs that comprise GMI.F.
Learn To Use R For Portfolio Analysis
Quantitative Investment Portfolio Analytics In R:
An Introduction To R For Modeling Portfolio Risk and Return
By James Picerno


