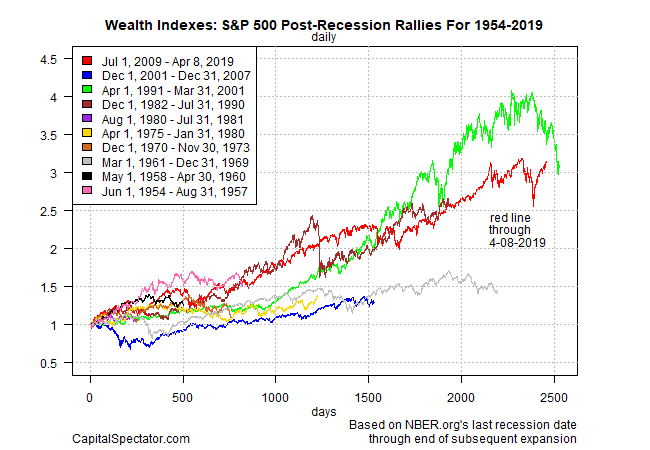
The US stock market continued to defy gravity and edged up on Monday. The S&P 500 posted its eighth straight daily gain, marking its longest rally since 2017. Meanwhile, another milestone for the market’s bullish momentum is unfolding, based on the length of the increase in equity prices since the end of the last recession. Assuming that the current economic expansion continues through June, the current post-recession rally for the S&P 500 is on track for a record-setting endurance run.
There’s a running debate about definitions for bull and bear markets, but one way to quantify how equities fare through an economic lens is by measuring changes between recessions. By that standard, the current run — which began after the last economic contraction ended in June 2009 (via NBER data) — is less than two months away from matching the record since the 1950s: the 2,528 trading days for the S&P 500’s 1991-2001 bull market (green line in chart below).
The current rise in equity prices (red line in chart above) is a bit shorter at 2,459 trading days (through yesterday, April 8). That’s just 69 trading sessions short of the 1991-2001 marathon. Assuming the economy continues to expand, a critical source of market support appears poised to carry the S&P to a record-setting spring since the modern era of trading began in the 1950s.
From a business-cycle perspective, the odds still favor that the US economic expansion will continue for the near term and match or even exceed the current record: 120 months for 1991-2007. If the economy is still growing in July, a new record will be set: 121 months.
Using last week’s macro profile as a guide, the odds still favor growth for the US outlook. Although the expansion has slowed, recession risk remains low, based on data published to date. Projecting the macro trend into the immediate future also points to a low probability that an NBER-defined downturn is near.
Note, however, that the there’s no law that the stock market must persistently rise during an economic expansion to the bitter end. At the tail end of the record-setting 1991-2001 upturn, for instance, the S&P 500 mostly fell in the final seven months of the expansion.
For the moment, there’s no sign of market weakness. The S&P 500 is up a strong 15.5% year to date, taking the sting out of the sharp correction in late-2018. Analysis that considered a darker profile, including cautionary reviews on these pages (such as this one) have fallen short. As a result, buy-and-hold reigns supreme and US stocks remain priced for perfection.
But a lot can happen between now and the end of June, when the S&P will match the record 1991-2001 run. The question, of course, is whether anything will happen that derails the second-longest rally in the past 60-plus years before it takes the crown? No, or so one can argue, courtesy of Mr. Market’s sentiment in the past eight trading sessions.
Learn To Use R For Portfolio Analysis
Quantitative Investment Portfolio Analytics In R:
An Introduction To R For Modeling Portfolio Risk and Return
By James Picerno

Pingback: Weighing the Week Ahead: What Will Q1 Earnings Reveal About Economic Strength? | Dash of Insight
Pingback: Q1 Earnings Reports Will Tell Us about the Strength of the Economy - TradingGods.net