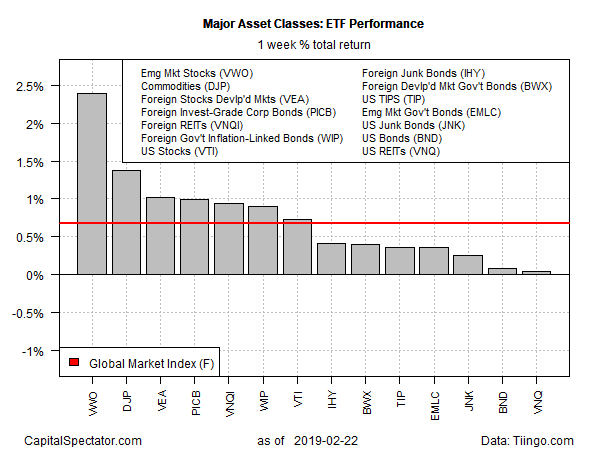
Led by a strong increase in emerging-market stocks, a buying spree lifted all corners of global markets last week, based on a set of exchange-traded products.
Vanguard FTSE Emerging Markets (VWO) jumped 2.4% for the trading week ended Feb. 22. Although the ETF has been trending higher for two months, the latest gain is the first weekly advance this month.
The rally in emerging markets spilled over to today’s trading, supported by news that President Trump has delayed a deadline for imposing new trade tariffs on imports of Chinese goods.
“I suspect given Trump’s personal involvement, we will probably see a deal being reached,” says Gareth Leather, a senior economist with Capital Economics. But “if Trump is serious about the reservations he’s had about China, I don’t think they are going to be resolved with a deal, given how intractable they are.”
Learn To Use R For Portfolio Analysis
Quantitative Investment Portfolio Analytics In R:
An Introduction To R For Modeling Portfolio Risk and Return
By James Picerno
The weakest performer last week: US real estate investment trusts (REITs). Vanguard Real Estate (VNQ) ticked up fractionally, but that was enough to lift the ETF for a seventh straight week.
The broad gains last week pushed an ETF-based version of the Global Markets Index (GMI.F) higher. This investable, unmanaged benchmark that holds all the major asset classes (except cash) in market-value weights rose 0.7%.
Although Vanguard Real Estate was a laggard last week, the ETF continues to post the strongest gain – by far – for the one-year-return window for the major asset classes. At Friday’s close, VNQ was up a sizzling 20.7% on a total-return basis vs. a year ago.
The second-strongest one-year gain is held by US stocks. Vanguard Total Stock Market (VTI) is up 5.7% — a respectable increase, but one that pales next to VNQ’s surge.
There’s plenty of red ink elsewhere on the one-year ledger. The biggest setback is in emerging-market stocks. Despite the recent strength in VWO, the ETF is still down by more than 10% vs. the year-ago level, even after factoring in distributions.
GMI.F’s one-year change is a slight 1.1% increase over the past year.
For current drawdown, Vanguard Real Estate (VNQ) and SPDR Bloomberg High Yield Bond (JNK) are tied with zero peak-to-trough declines.
Meanwhile, broadly defined commodities continue to suffer the biggest drawdown. The iPath Bloomberg Commodity (DJP) closed last week with a drawdown close to -50%.
GMI.F’s current drawdown: -3.6%.
Is Recession Risk Rising? Monitor the outlook with a subscription to:
The US Business Cycle Risk Report


Pingback: Buying Spree Lifted All Corners of Global Markets Last Week - TradingGods.net
Pingback: Landmark Links February 26th – Picked Over