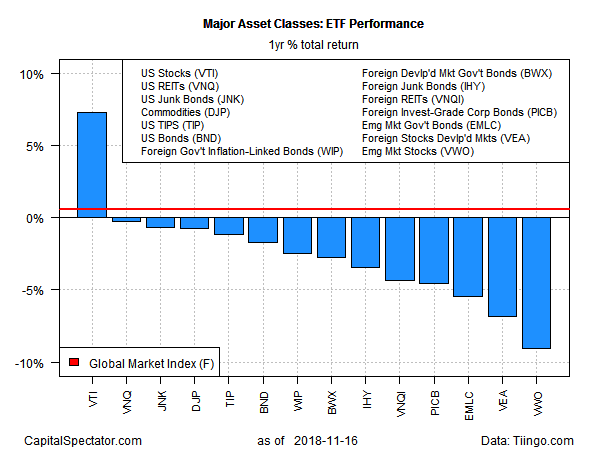
And then there was one. The slow grind of selling in global markets this year has left the US equity market with the lone positive total return for the trailing one-year trend among the major asset classes, based on a set of exchange-traded products through last week’s close.
The upside distinction for US stocks is doubly striking because this market not only stands alone with a positive year-over-year change (using a trailing 252-trading-day period). The size of the gain is also notable when stacked up against the red ink that otherwise prevails for the major asset classes.
Vanguard Total Stock Market (VTI), which targets a broad set of US equities, was up 7.3% for the trailing one-year period through the close of trading last week (Nov. 16). The respectable performance is well below the one-year gains that VTI had been posting earlier in the year, but the downsized increase still leaves the rest of the field in the dust.
Is Recession Risk Rising? Monitor the outlook with a subscription to:
The US Business Cycle Risk Report
All the major asset classes, other than US equities, are nursing losses for the one-year window, ranging from a fractional 0.3% decline for securitized real estate — Vanguard Real Estate (VNQ) – to a steep 9.1% slide for stocks in emerging markets via Vanguard FTSE Emerging Markets (VWO).
Meantime, an ETF-based version of the Global Markets Index (GMI.F) is holding on to a small gain for the trailing one-year period. This investable, unmanaged benchmark that holds all the major asset classes in market-value weights is ahead, just barely, with a 0.6% total return as of Friday’s close vs. the year-ago price after factoring in distributions.
Ranking the major asset classes by drawdown shows that most markets are posting modest peak-to-trough declines at the moment (no more than -10%). The smallest current drawdown can be found in a broad measure of US investment-grade bonds: Vanguard Total Bond Market (BND) closed last week at just 2.6% below its previous peak.
As for the deepest current drawdown, that title is held by a portfolio of broadly defined commodities: iPath Bloomberg Commodity (DJP) is trading nearly 50% below its previous summit.
GMI.F, by comparison, has a modest drawdown of roughly -7%.
Interested In Learning R For Portfolio Analysis?
Quantitative Investment Portfolio Analytics In R:
An Introduction To R For Modeling Portfolio Risk and Return
By James Picerno

