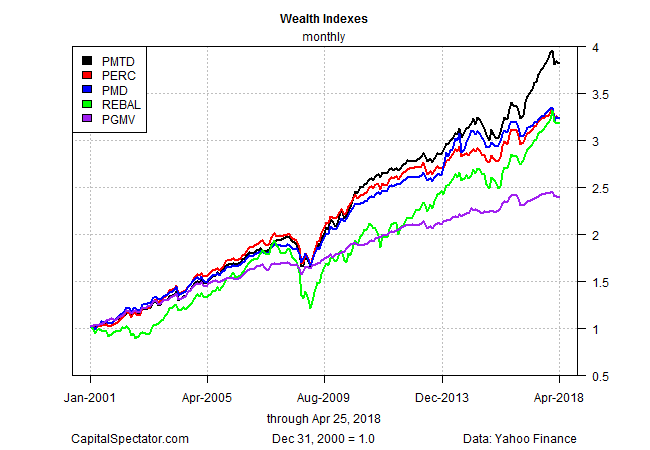
Investing strategies run the gamut, but every portfolio shares a common goal: delivering optimal results. The catch is that there’s a wide range of possibilities for defining optimal and so your mileage may vary, depending on preferences, assets, and other factors. Eran Raviv offers a useful review by comparing how four strategies with different portfolio-design strategies stack up via number-crunching in R with the FRAPO package. Let’s build on his profile by analyzing how the strategies fare with a broader set of asset classes based on resetting the optimized weights at the end of each year starting in 2001.
The benchmark for our toy backtest is a simple portfolio using a mix of US and foreign funds targeting stocks, bonds, plus US real estate investment trusts (REITs) and a gold fund. This strategy (REBAL) will be rebalanced back to the target weights shown below at the end of each calendar year.
Inspired by Raviv’s post, let’s use these funds to compare REBAL’s results with four portfolio strategies that fall under the heading of variations on the portfolio optimization concept. In each case, a quantitative solution for setting asset weights is obtained for a specific portfolio objective:
PERC: portfolio equal risk contribution
PGMV: portfolio global minimum variance
PMTD: portfolio minimum tail dependence
PMD: portfolio most diversified
For summaries on the design rules, see Raviv’s post noted above. You can also find details in Financial Risk Modelling and Portfolio Optimization with R by Bernhard Pfaff, the author of the FRAPO package.
From the perspective of raw return, PMTD wins the horse race, based on a start date of Dec. 31, 2000. In last place: PGMV. The remaining three strategies delivered middling results, based on ending values. But on closer inspection it’s clear that there’s more to the story.
When we look at the results through a risk lens the numbers indicate that PGMV, although generating the lowest performance, posted the smallest maximum drawdown.

Note, too, that the simple end-of-year rebalanced strategy (REBAL) suffered the biggest drawdown by far. That’s a sign that the other four strategies appear to do a better job of managing risk. Indeed, Sharpe ratio and Sortino ratio — risk-adjusted performance metrics – are substantially higher for PERC, PGMV, PMTD, and PMD vs. REBAL.
The message is that optimization algorithims for portfolio design and management can be powerful tools in the quest for maximizing return and minimizing risk. The analysis above is hardly the last word on the subject, but the numbers suggest that investors who prioritize risk management over performance should investigate the finer points of optimization strategies for the care and feeding of investment portfolios.
When will the next recession strike? Monitor the outlook with a subscription to:
The US Business Cycle Risk Report


Pingback: Analyzing Investment Strategies - TradingGods.net
Pingback: Quantocracy's Daily Wrap for 04/26/2018 | Quantocracy