With only days left to the trading year, American shares look set to outperform the rest of the world’s major equity regions, based on a set of exchange-traded products listed in the US.
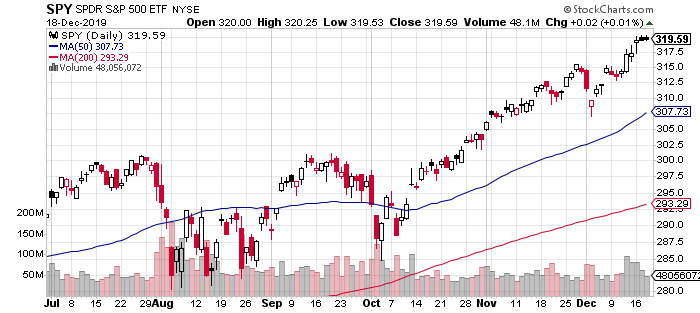
SPDR S&P 500 (SPY) is currently in first place for 2019 among funds representing the main slices of the planet’s regional stock markets. Anything can happen between now and the end of the year, of course, and so it’s not over till it’s over. But at the moment, SPY’s in first place, posting a strong 29.7% on a total return basis through last night’s close (Dec. 18). The fractional gain in yesterday’s trading left the ETF at yet another record high.
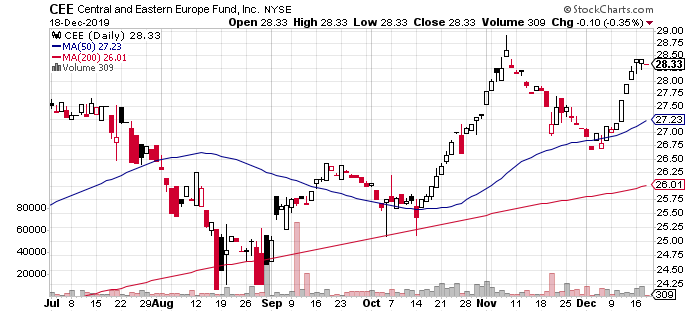
A close runner-up this year is Central and Eastern Europe (CEE), a closed-end fund that offers the only US-exchange-listed product that targets this region of the world. The fund’s current year-to-date gain: 28.9%, just slightly behind’s SPY’s 2019 rally.
The rest of the field is well behind these two regional leaders. Note, however, that all the funds on the regional list in the chart below are currently posting year-to-date gains. The weakest performer: WisdomTree Middle East Dividend (GULF), the lone regional Mideast equity ETF trading in the US. Through Wednesday’s close, GULF is up a relatively a modest 9.4%.
Learn To Use R For Portfolio Analysis
Quantitative Investment Portfolio Analytics In R:
An Introduction To R For Modeling Portfolio Risk and Return
By James Picerno
Global shares overall are posting a solid gain this year, based on Vanguard Total World Stock (VT). The ETF ended yesterday’s trading at a record high, posting a 25.6% year-to-date gain.
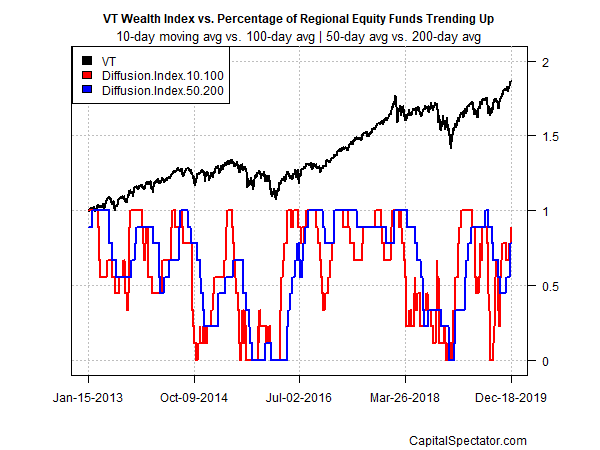
Reviewing all the regional and country funds listed above through a momentum lens shows that the bullish trend has been strengthening lately. The analysis is based on two sets of moving averages, which point to a broad-based upside bias overall for global shares. The first measure compares the 10-day average with its 100-day counterpart — a proxy for short-term trending behavior (red line in chart below). A second set of moving averages (50 and 200 days) represent an intermediate measure of the trend (blue line). Based on the these metrics, the near-term momentum profile remains firmly bullish.
Is Recession Risk Rising? Monitor the outlook with a subscription to:
The US Business Cycle Risk Report


Pingback: US Stocks Outperform World's Major Equity Regions - TradingGods.net
Pingback: This Week’s Best Investing Articles, Research, Podcasts 12/20/2019 - Stock Screener - The Acquirer's Multiple®