The value factor has fallen on hard times in recent years, prompting debate about whether this risk premium can recover as technology-fueled growth stocks eat the world. The counterpoint is that value and growth have long traded leadership positions and eventually value wins the race. Is it different this time? Unclear. While we’re waiting for Mr. Market to render a verdict, let’s explore the value-growth dance through a rolling-one-year-return lens for perspective.
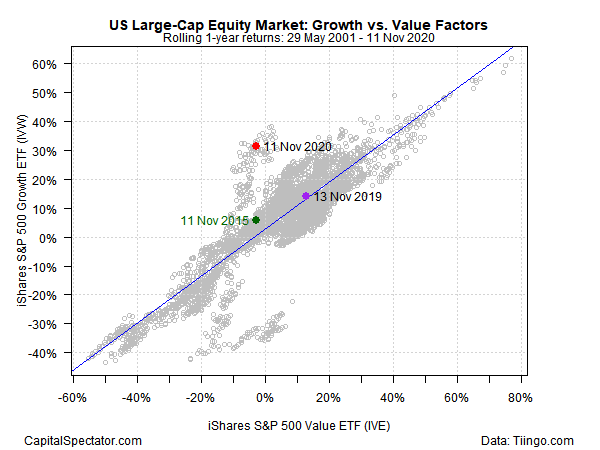
First up is the US large-cap equity space, based on a pair of proxy ETFs: iShares S&P 500 Value (IVE) and iShares S&P 500 Growth ETF (IVW). Growth has topped value in this corner in recent years and the gap has widened substantially in 2020. At yesterday’s close (Nov. 11), growth (IVW) is up a sizzling 31.4% from the year-ago price on a total-return basis (based on a 252-trading-day window). Value stocks, by contrast, are down 2.8% over that span.

The return spread is unusual, relative to the historical record for these funds (these ETFs were launched in 2000). In the chart above, the red dot represents the current 1-year performances. The current gap isn’t unprecedented, but it’s in a cluster of results that represent an outlier relative to the “usual” trend, as indicated by the blue regression line for the full-sample period since 2000.
The one-year-return spreads from a year earlier, and five-years earlier, suggest that the value factor is having a tough time breaking out of its second-class status.
For comparison, let’s turn to the value-growth race for US small-cap stocks via another set of proxy ETFs: iShares S&P Small-Cap 600 Value (IJS) and iShares S&P Small-Cap 600 Growth (IJT). The second chart below reveals a relatively behaved relationship compared with the substantially wider spread range for large caps. Nonetheless, small-cap value (IJS) is still trailing growth (IJT) by wide margin over the past year, albeit by lesser degree relative to large caps: 9.4% vs. a 2.8% loss.

Recent performance data suggests that the small-cap-return relationship is comparatively stable vs. large caps. One implication: the odds may be higher for earning a value premium over growth via small caps compared with large caps.
Is there something unique in the small-cap space that provides a greater probability of earning a risk premium relative to large caps? Although we can’t answer that question with the charts above, it’s an intriguing possibility that appears to have a degree of support.
Learn To Use R For Portfolio Analysis
Quantitative Investment Portfolio Analytics In R:
An Introduction To R For Modeling Portfolio Risk and Return
By James Picerno
Pingback: The Value Factor - TradingGods.net
Pingback: This Week’s Best Investing Articles, Research, Podcasts 11/13/2020 - Stock Screener - The Acquirer's Multiple®