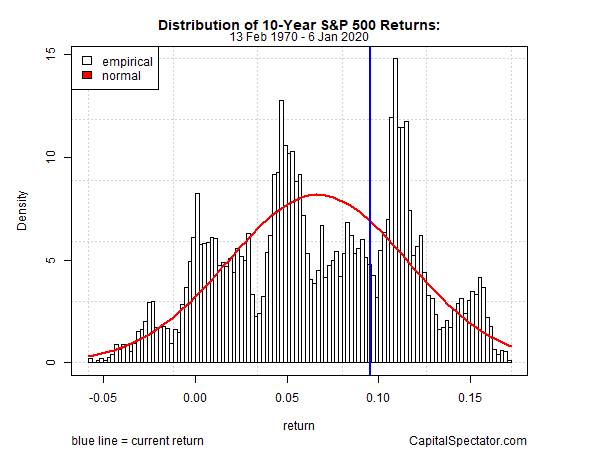
The bull run in US equities in recent years strikes many investors as something other than a run-of-the-mill rally. Although Mr. Market has dispensed several sharp corrections, it’s hard to overlook the fact that a buy-and-hold strategy for, say, an S&P 500 Index fund has been a mostly non-stop party of late. Is that unusual? The answer depends on your definition of “unusual” and your choice of a time window. For some perspective, let’s stack up the latest trailing performances for the S&P against its track record through the decades.
Let’s begin with rolling 1-year returns since 1960 (based on 252 trading days). The current one-year performance (through yesterday, Jan. 6) is 28.2%. That’s an impressive gain, but is it out of the ordinary? Yes, it is. As the chart below shows, the top-quartile distribution of one-year returns for the S&P 500 since 1960 is a 18.3%-to-68.6% range. By that standard, the current one-year advance (indicated by the blue line) is easily in the top quartile—in fact, it’s a top-decile return. (The red line shows the theoretical returns if results followed a normal distribution.)
Next, consider how the latest 5-year annualized return compares with history (1260 trading days). The current 9.5% increase is middling relative to history since 1965 — the performance ranks just below the median return. To be sure, earning a 9.5% through time is no one idea’s of weak results. But from the perspective of how the S&P has behaved for this time window the current 5-year performance is hardly extraordinary.
Let’s conclude our brief review of performance distributions with the 10-year annualized return, which is currently 11.2% (based on 2520 trading days). That translates to just below the 80th decile – a moderately extraordinary result.
In an upcoming post, I’ll continue this series by comparing S&P 500 in terms of risk and reviewing how the current profile stands up vs. history.
Learn To Use R For Portfolio Analysis
Quantitative Investment Portfolio Analytics In R:
An Introduction To R For Modeling Portfolio Risk and Return
By James Picerno


Pingback: Is Current Bull Run Extraordinary? - TradingGods.net
Pingback: Current Risk Levels for the US Stock Market - TradingGods.net